May 2026 Recap — Total Eclipse of the Chart: School Redistricting Dashboards
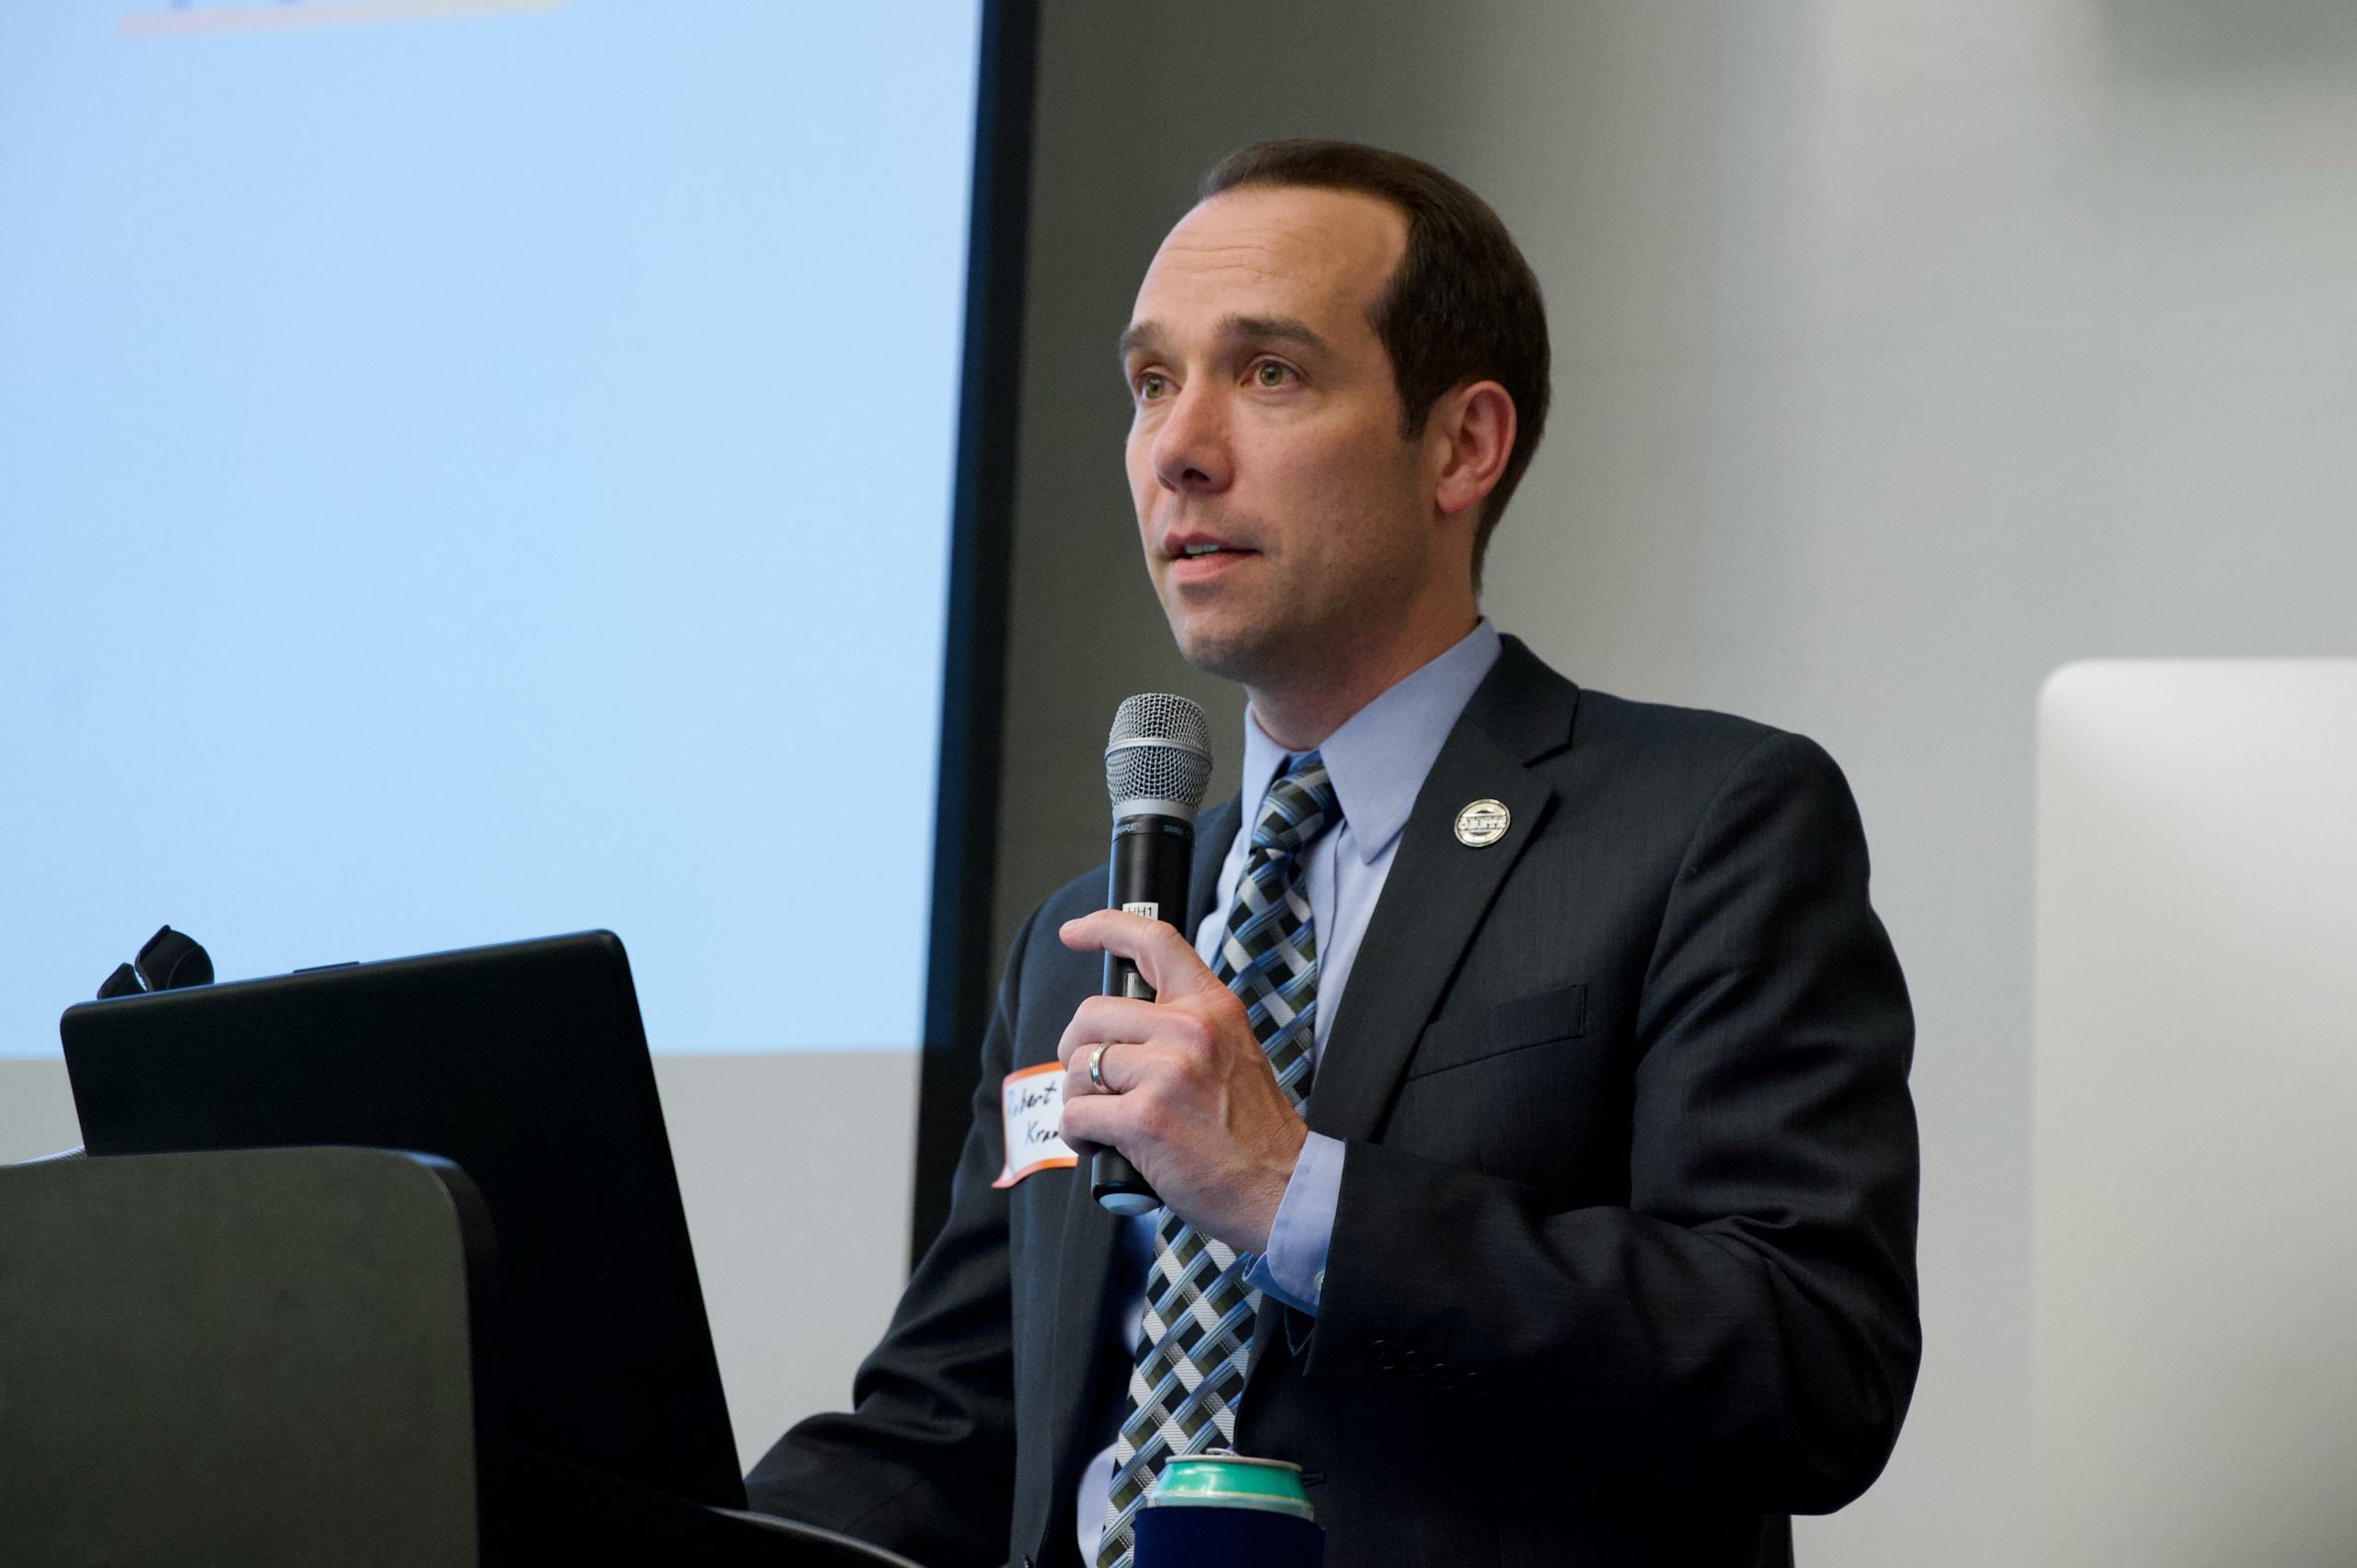
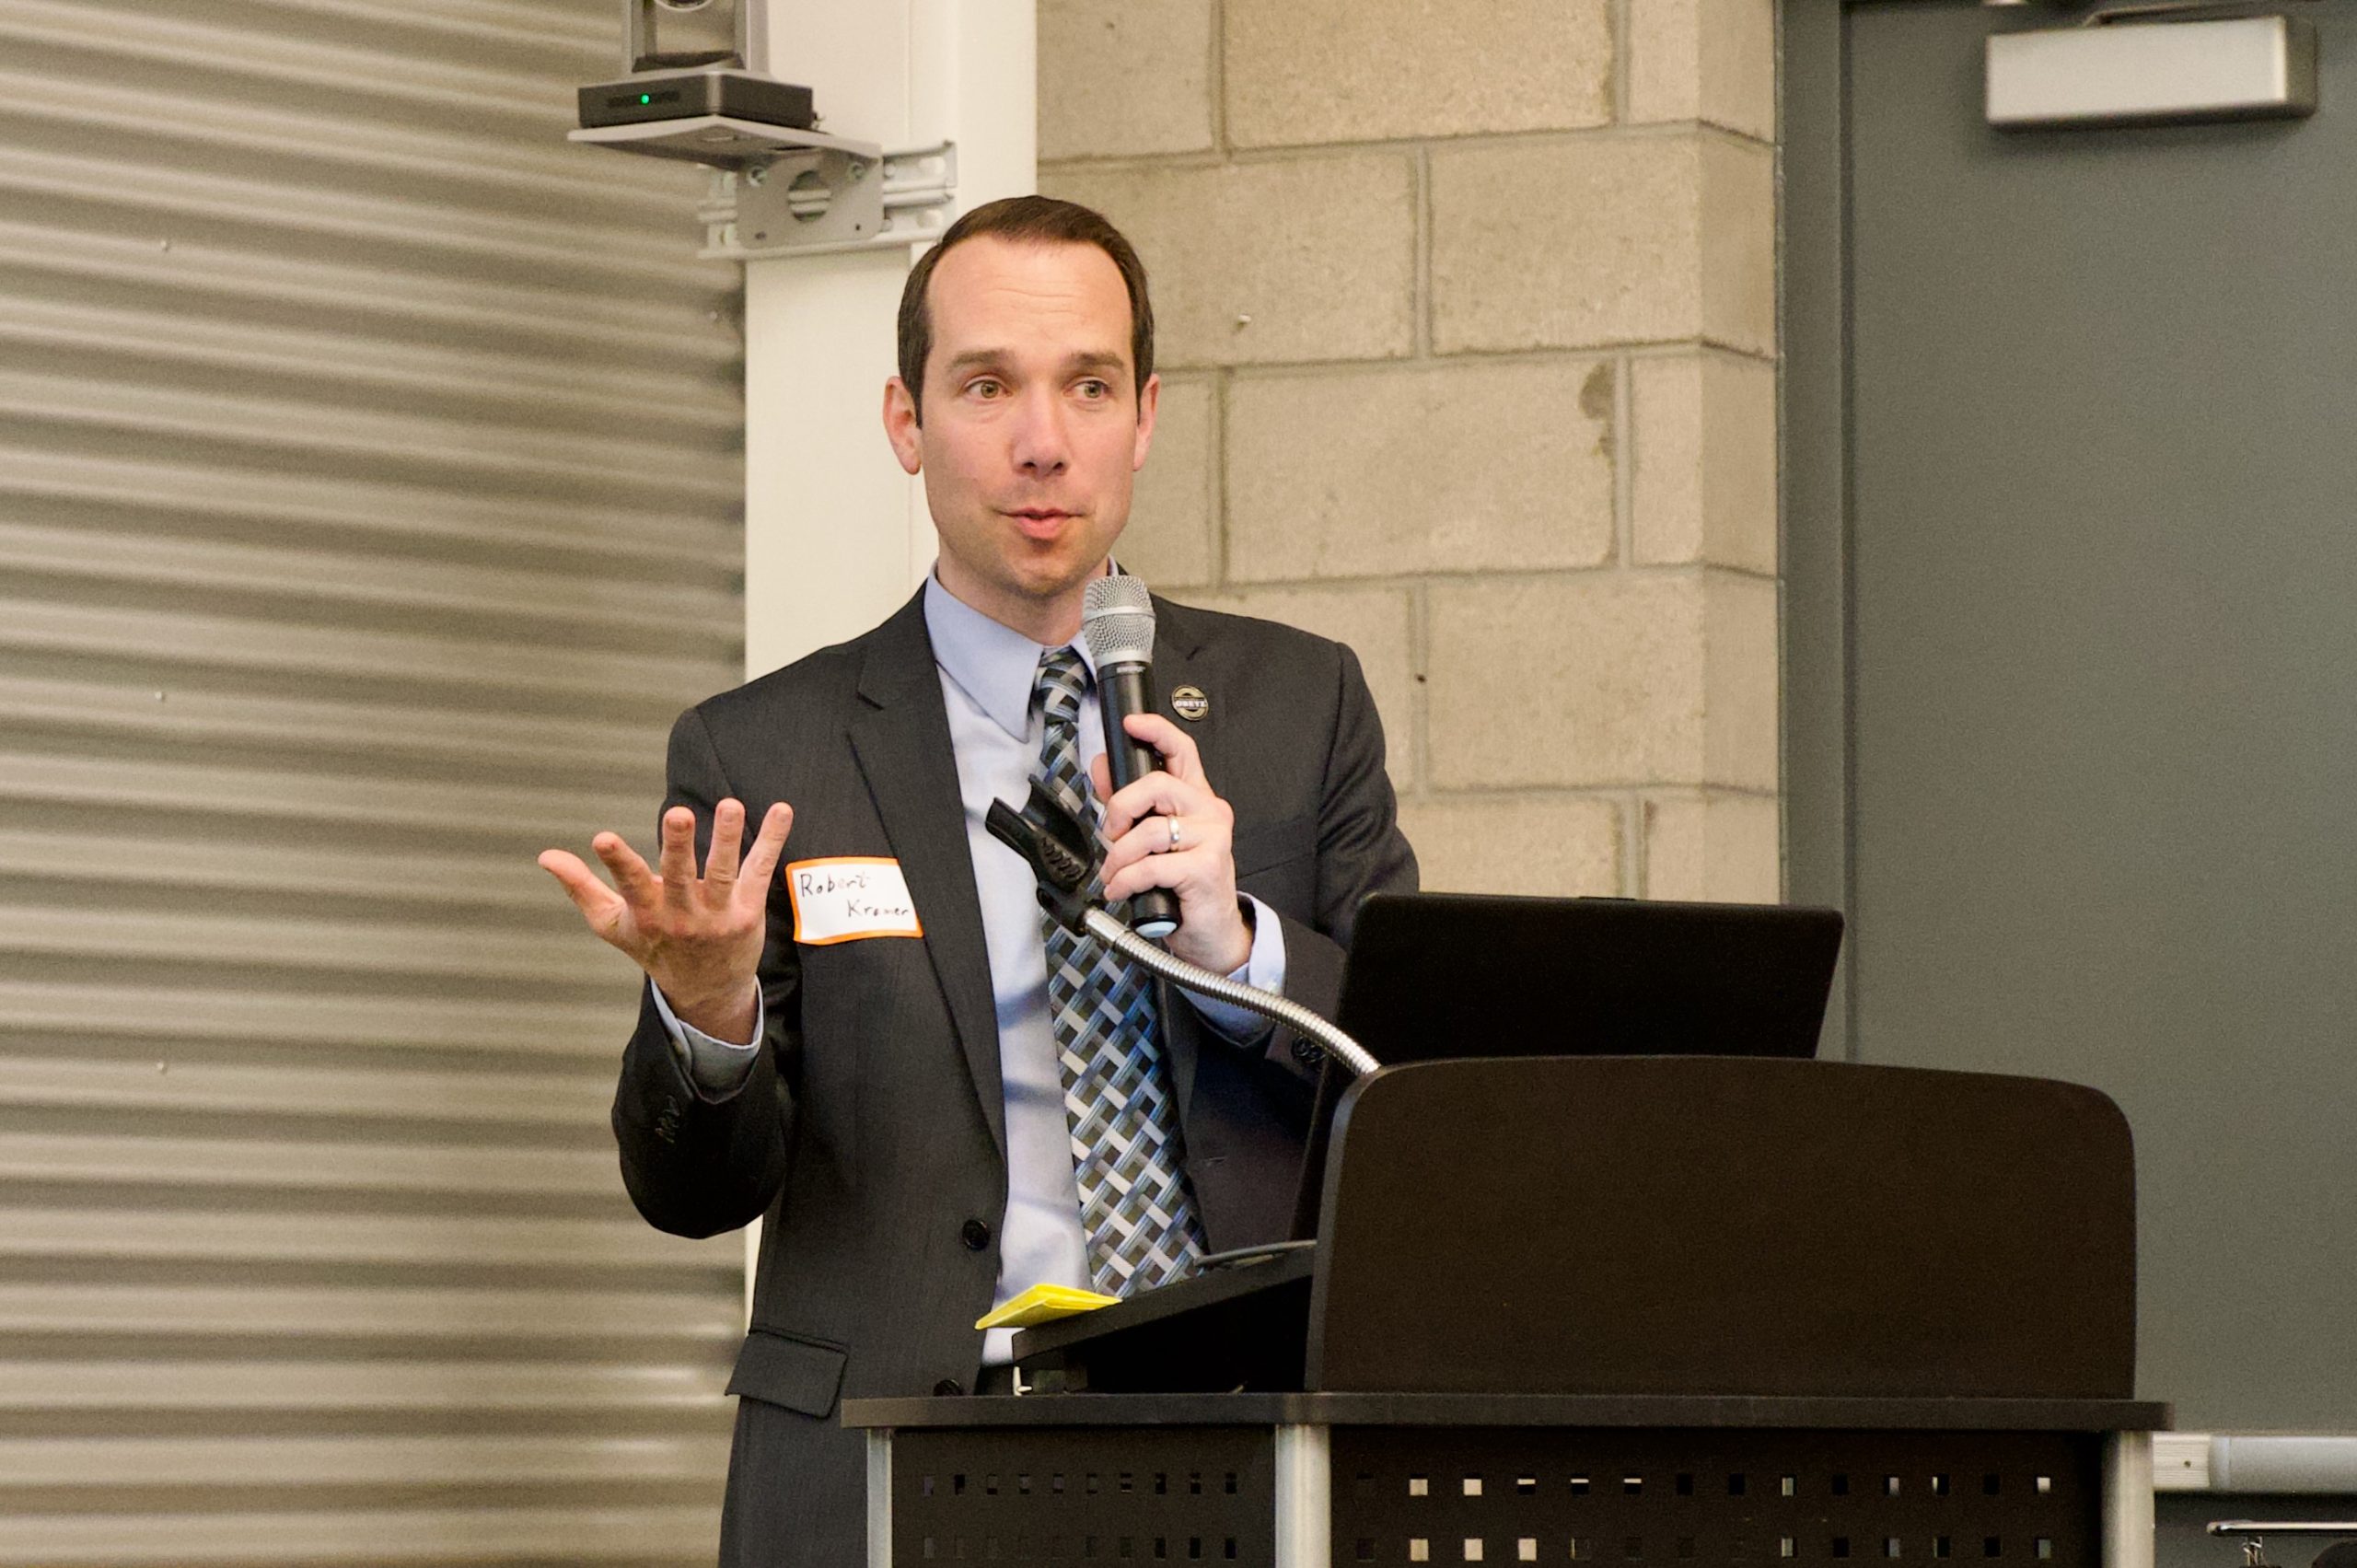
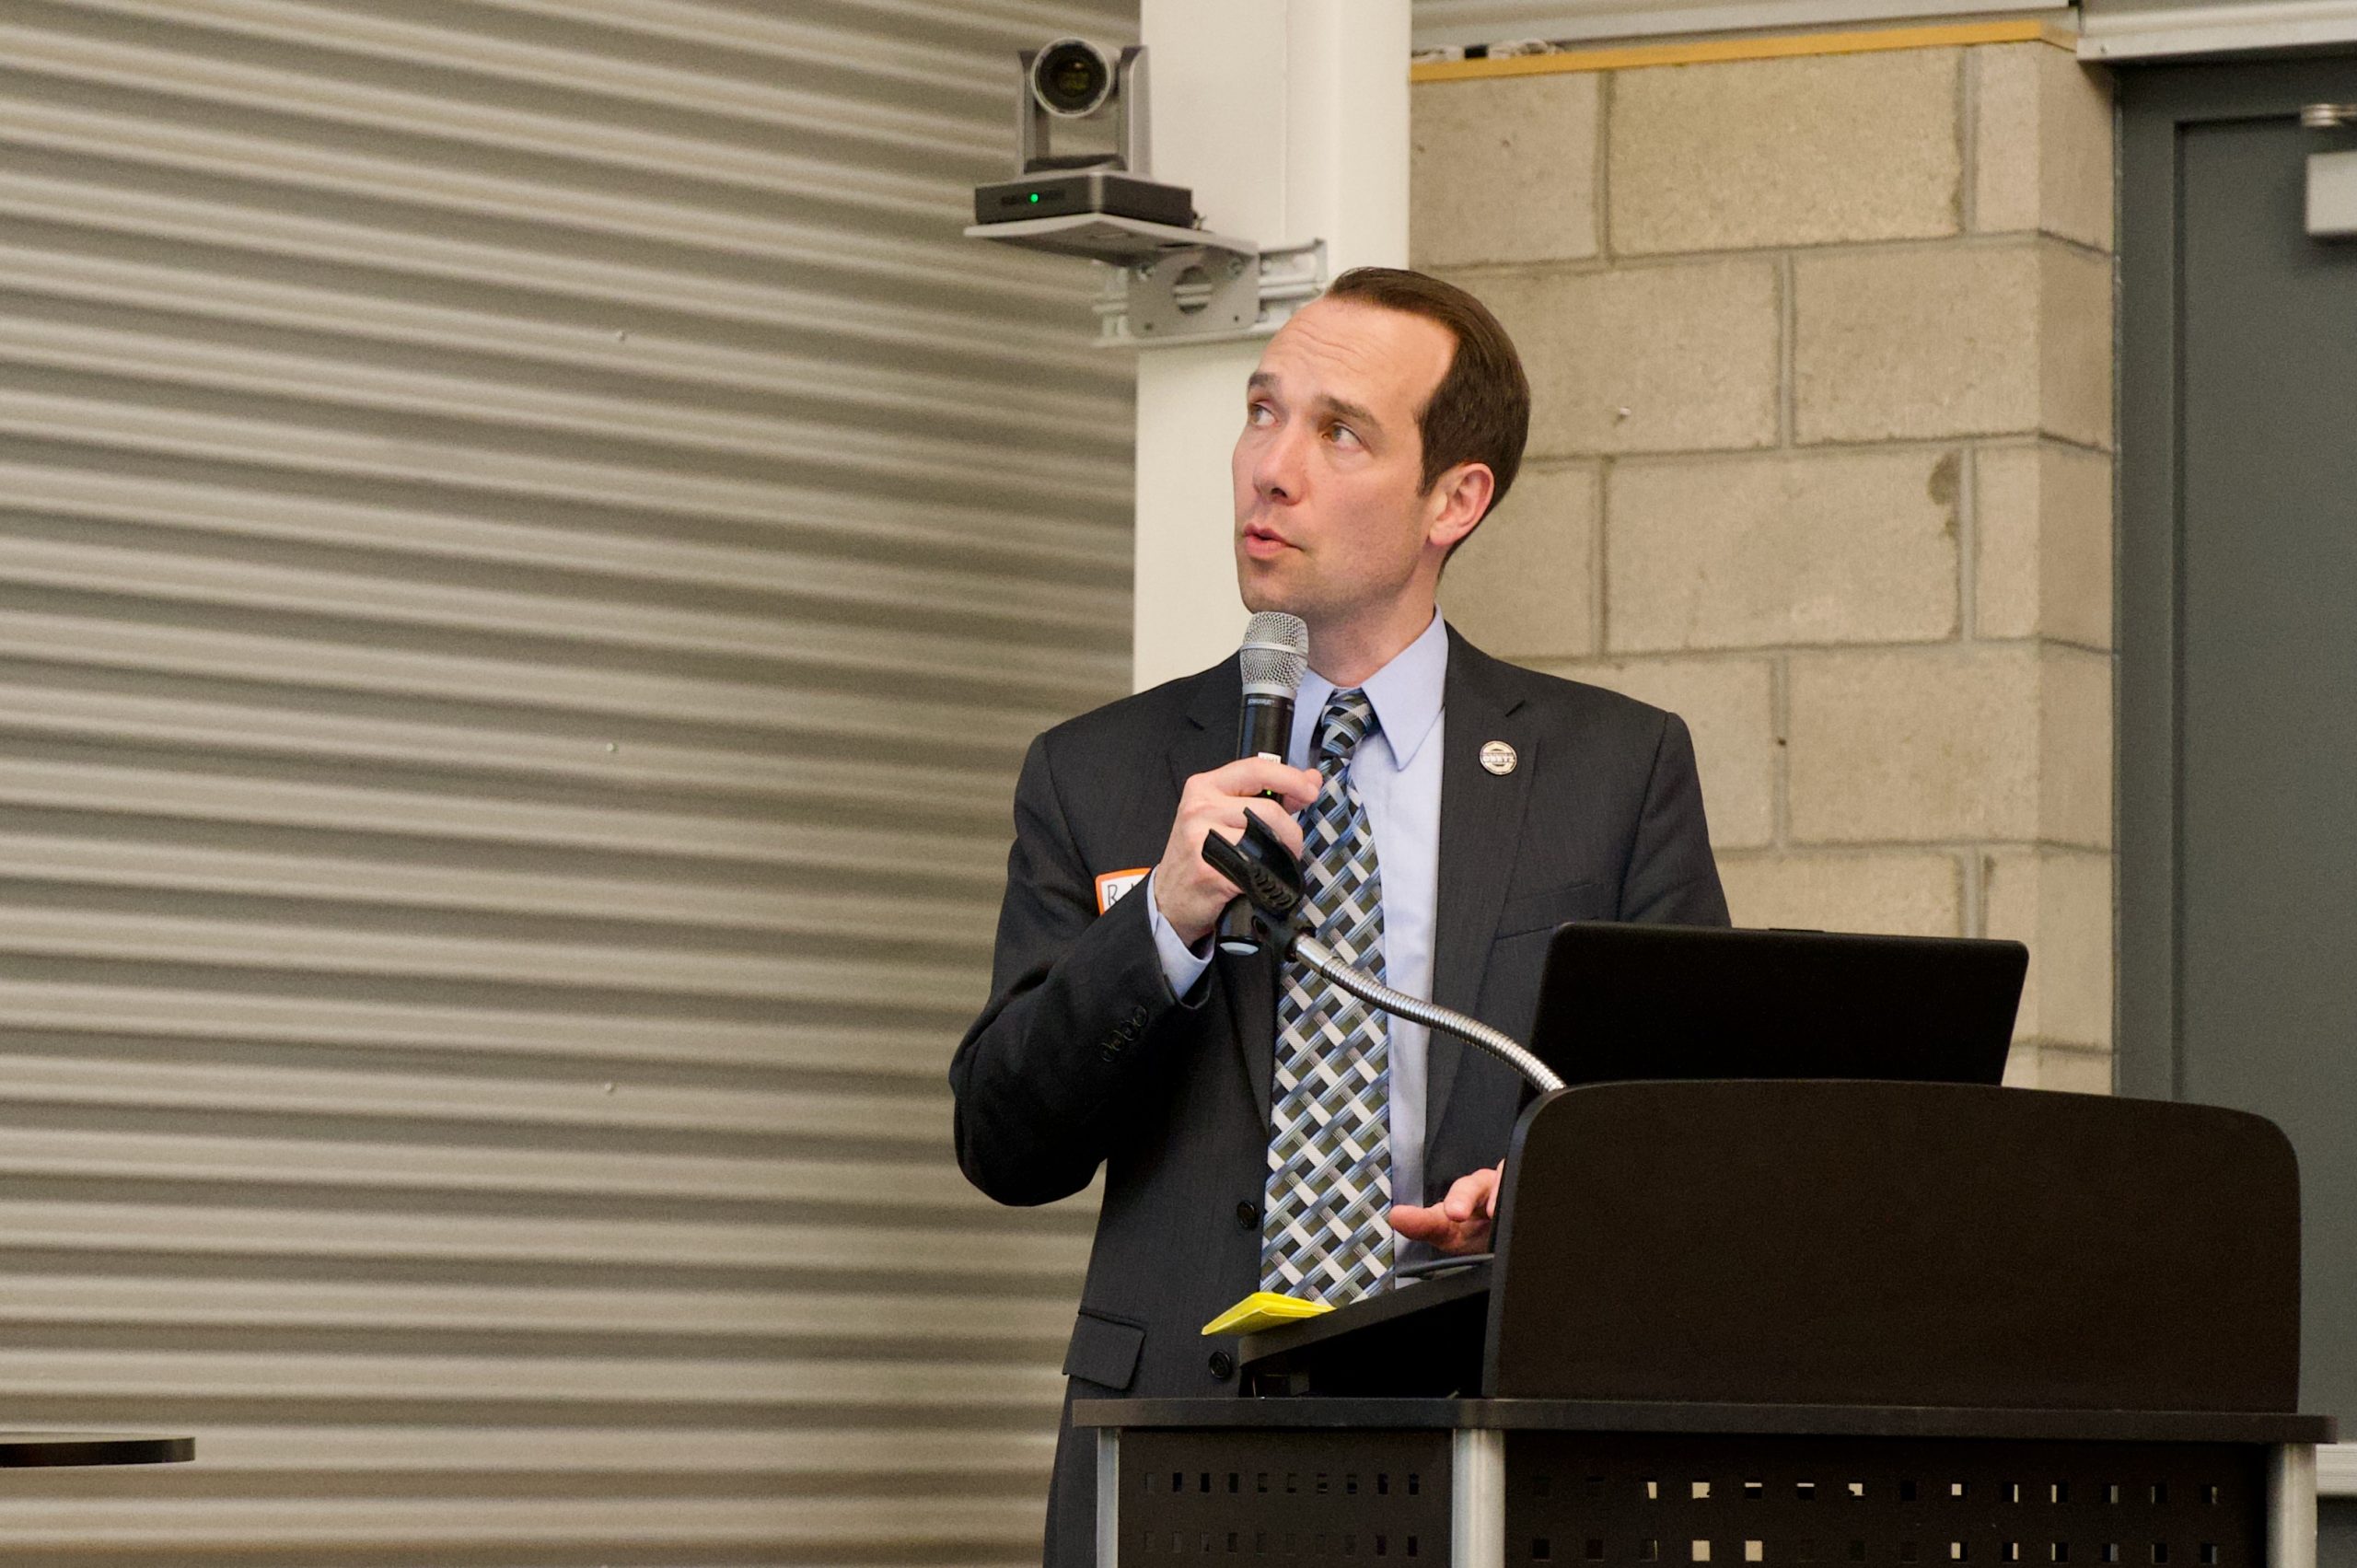
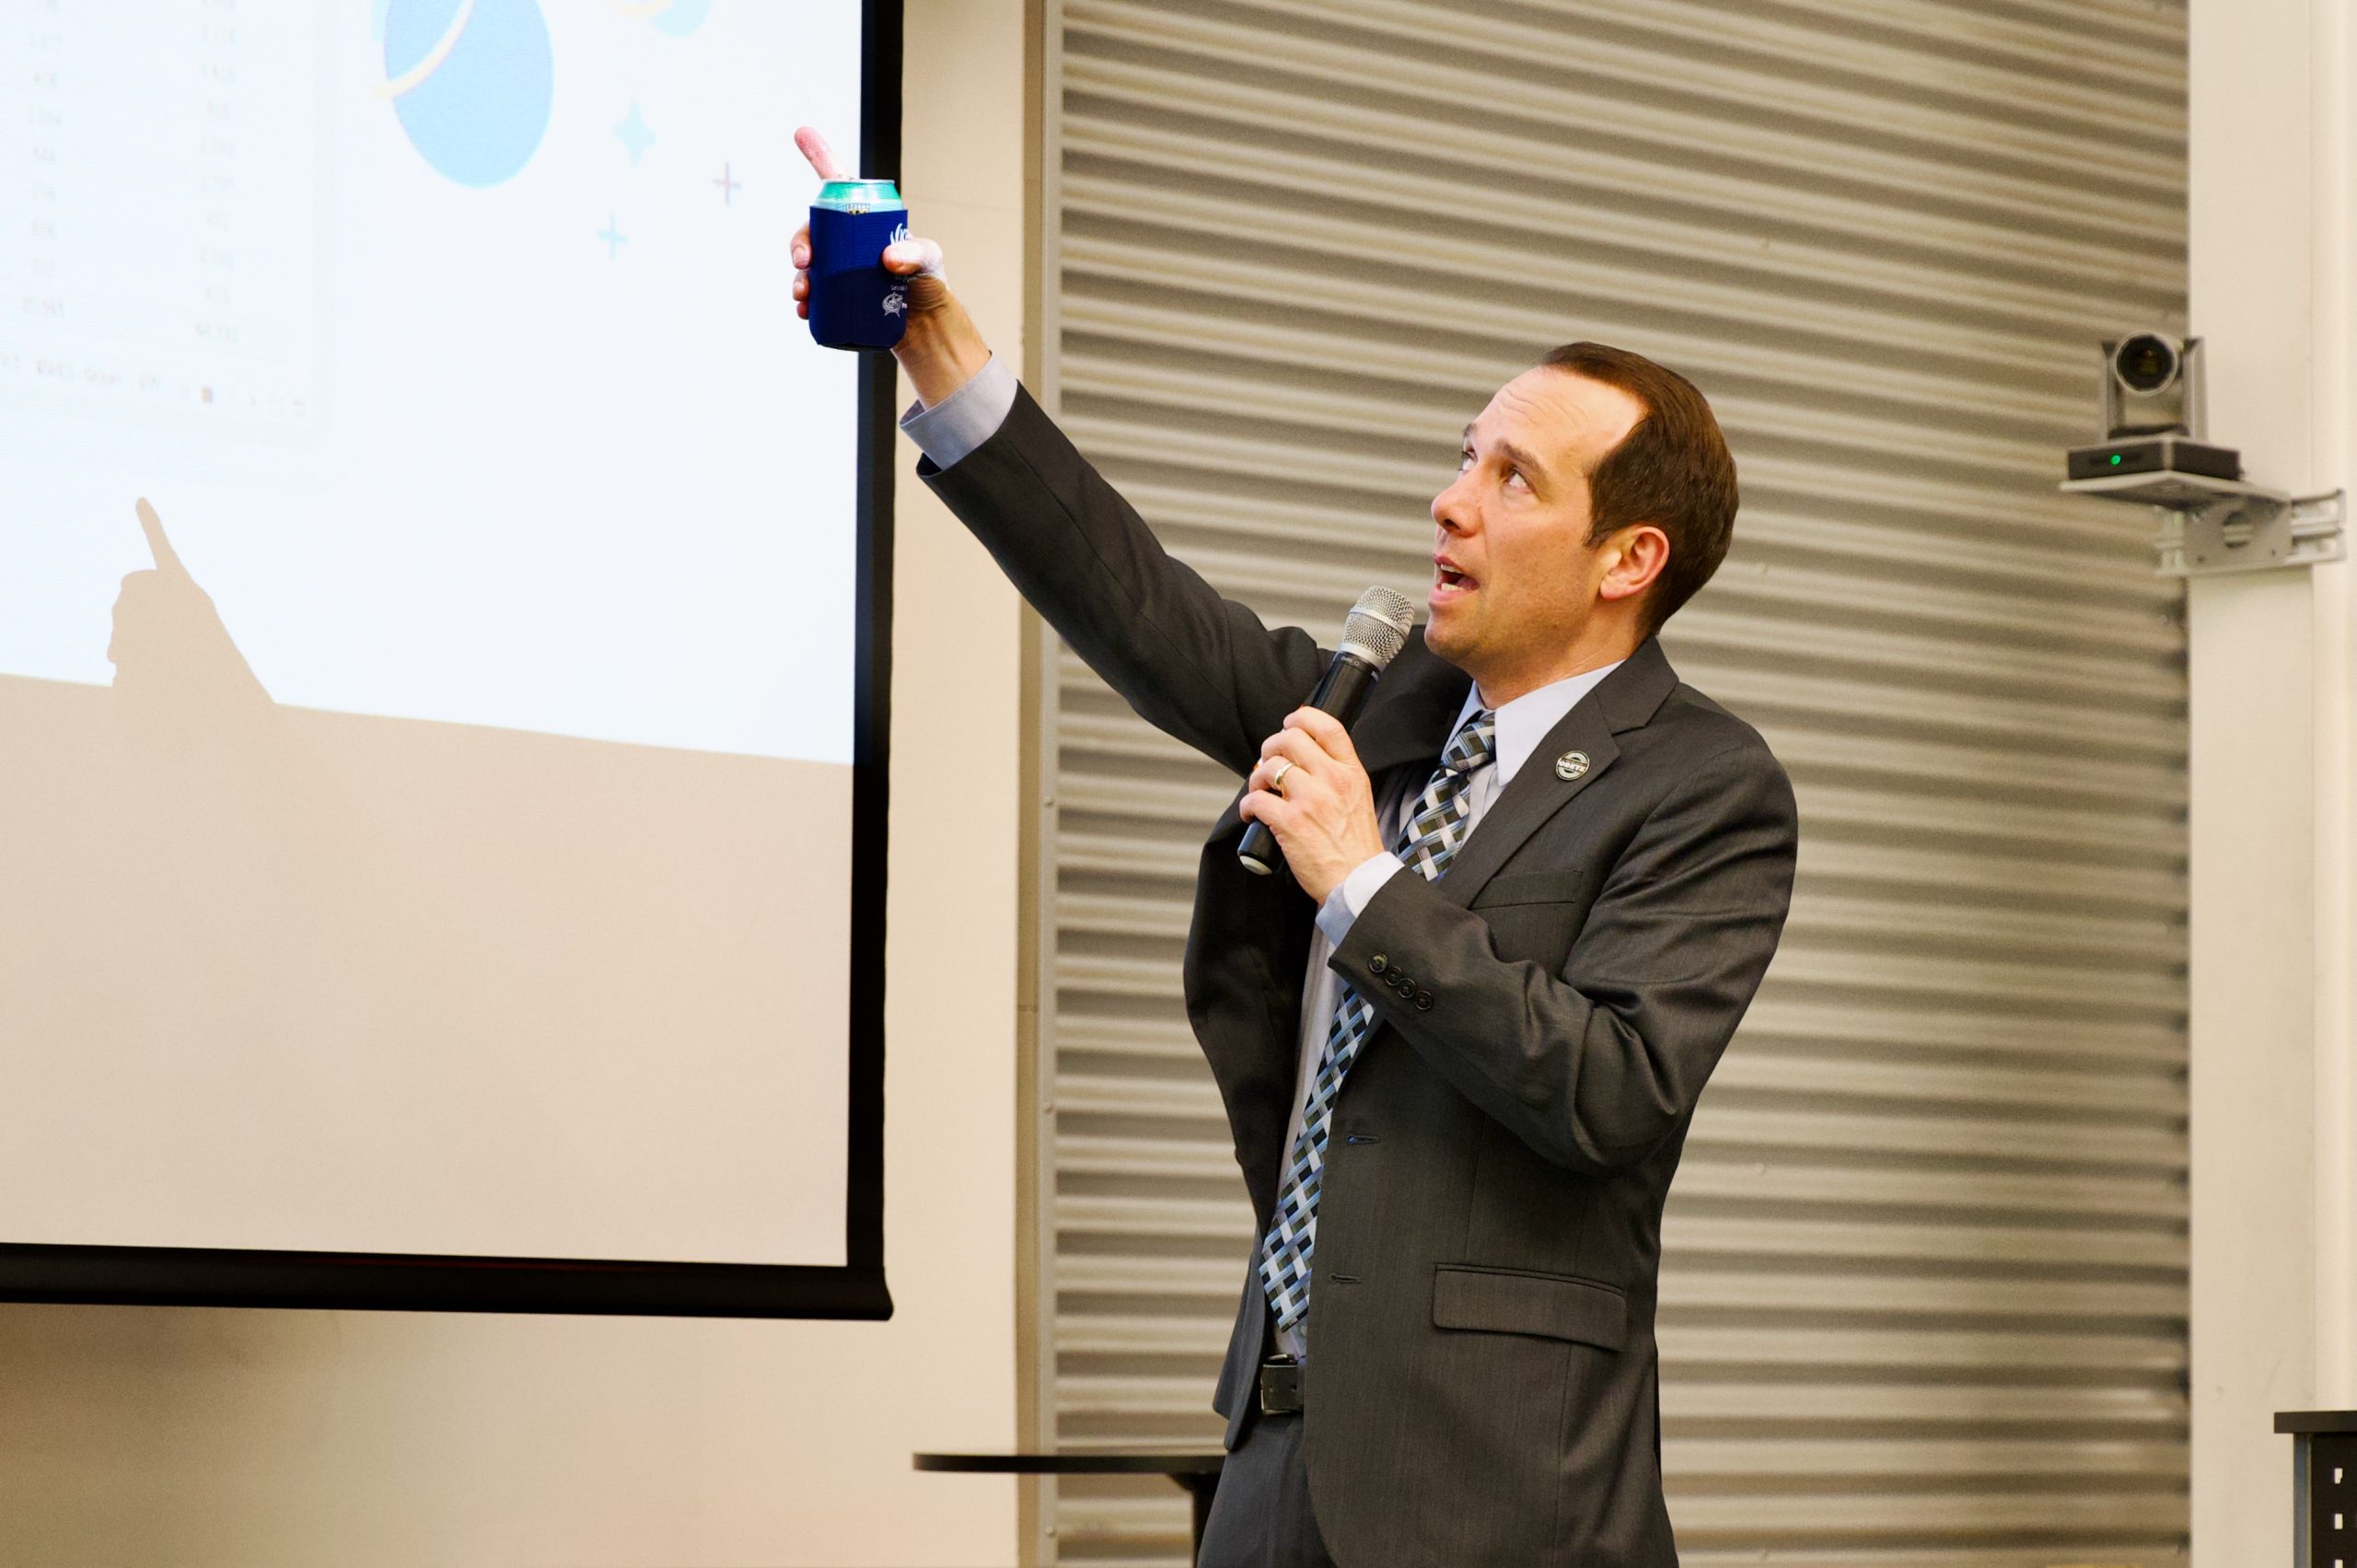
At our May event, Robert Kramer walked us through how the South Western City Schools District went about adjusting the boundaries for each school to account for both the shifting population and—the larger driver—the relocation, rebuilding, and new construction of various schools in the district.
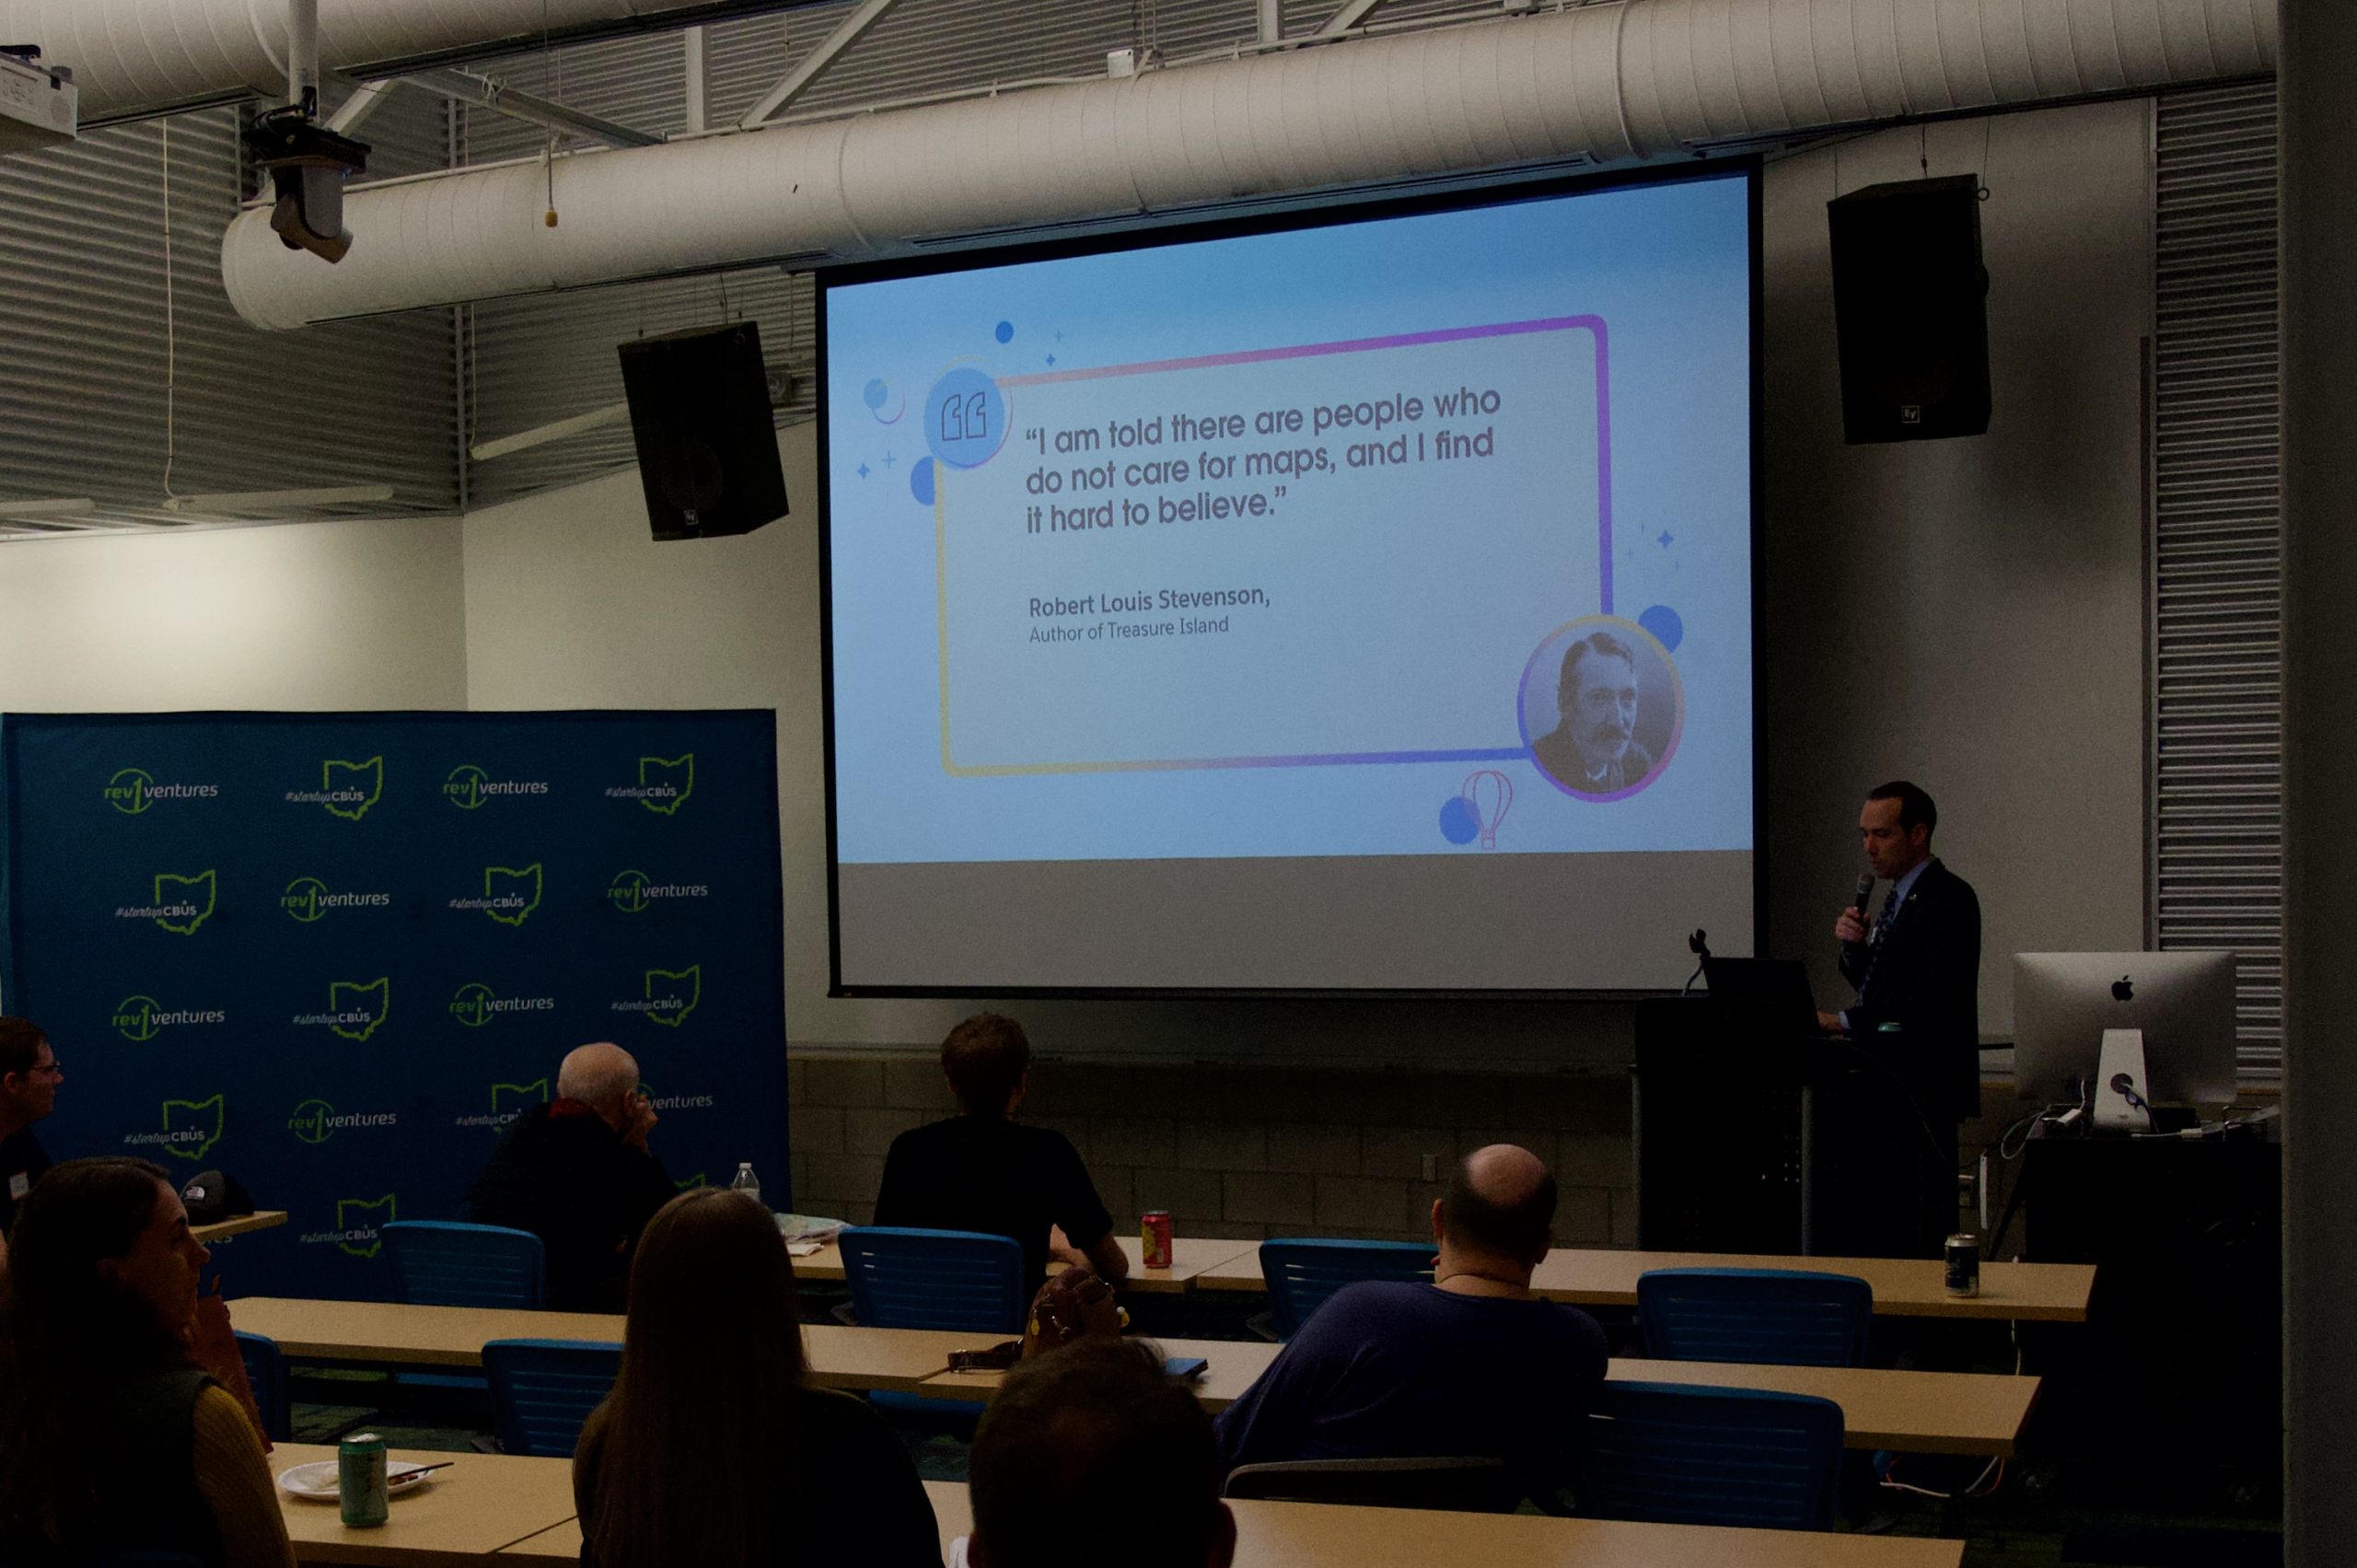
Robert opened with a quote from another Robert – Robert Louis Stevenson:
I am told there are people who do not care for maps, and I find it hard to believe.
The author of this recap certainly agrees with Stevenson’s assessment (ESRI! GIS! .shp! FTW!), but, like any domain, it’s downright fascinating to pull back the covers and consider the space through a “data” lens. Little “Oh! Interesting!” moments occurred throughout the session:
- Catchments—do you know that word? I did not. It’s a term for each unique combination of [Elementary School] > [Middle School] > [High School] that exists within a school district. Put another way, if you’re ever chatting with someone about schooling in a town and ask, “Oh, so did your kids go to X middle school?” you’re in catchment territory. How many catchments are in South Western City Schools? 37! Could it be lower? Yes. But there are 16 elementary schools, 5 middle schools, and 4 high schools plus a variety of specialty schools. The theoretical minimum catchment count is 16, but that’s not practical because… yeesh! Complicated!
- An individual’s address is sensitive information, but addresses themselves are not!—the district rigorously maintains a database of every address in the district, and every address is assigned to a specific catchment. That’s totally public information (if you’re buying a house in the district, you would might want to look up which schools kids in the household would go to at various ages).
- Forecasting growth for middle schools and high schools has a leg up on forecasting growth for elementary schools—the district knows how many 6th graders are at each address in the district, which means they can reasonably predict how many 11th graders will be at each address in five years. That’s a little trickier for pre-K and kindergarten, though, because the school doesn’t have details on not-yet-enrolled, in utero, or not yet conceived kiddos!
- “Redistricting history” is an important consideration—when drawing new districts, one consideration needs to be whether an address was already redistricted in the recent past. It’s just…not cool… for a household to be getting whipsawed between schools every few years because they live in a boundary-ish location.
- School boundaries (and entire school districts!) can cut through apartment buildings (or individual buildings!)—that’s tricky! If you thought the phenomenon of “the kids on the next street go to a different high school than my kids” was odd, imagine that happening within a single apartment complex!
- Schools don’t have to be located inside the boundaries of the district they serve—this was almost a throwaway comment Robert made during the Q&A, but there are situations where if a student lived in the basement of a particular school (no students live in the basement of any of South Western’s schools; this isn’t Rudy), they wouldn’t attend that school. Obviously, this is a corner case and, in practice, doesn’t affect anyone.
Of course, all of the above points to the fact that there are a lot more considerations than just “near-term-perfectly-optimized-boundaries”. What Robert and his team developed in this case was an interactive (Tableau-based) planning tool whereby the team could selectively pick different areas on a map, remove them from one school and then add them to another school and see the impact across a multitude of relevant measures. Ultimately, they landed on three main options that were presented to staff and the public, and there were no strong opinions or debates and the final option was smoothly settled upon.*
As the final flourish on the presentation, Robert showed how, once the final set of boundaries was established, they were able to then automatically generate the SQL from within the BI tool to do a mass update the underlying database!
Of course, shifting populations and growth mean that this work is never truly done, but it certainly seemed like we were seeing an example of how data—properly cleaned and integrated, and then surfaced in a meaningful way—both met and will continue to meet the demands of that work!
We were also happy to have donated to the South-Western City Schools Educational Foundation on behalf of Robert for this talk.
Slides from the event are below:
* Okay… maybe there were some strong opinions and debates. Tradeoffs and competing priorities mean that’s going to happen, but it really did seem like the transparency of the process combined with the readily available impacts on a range of measures for each option, made this all go much more smoothly than its gone in other school districts going through a similar process recently (<cough> Dublin City Schools <cough>. I live there, but was blissfully unaware; it’s nice to have kids well beyond high school age).
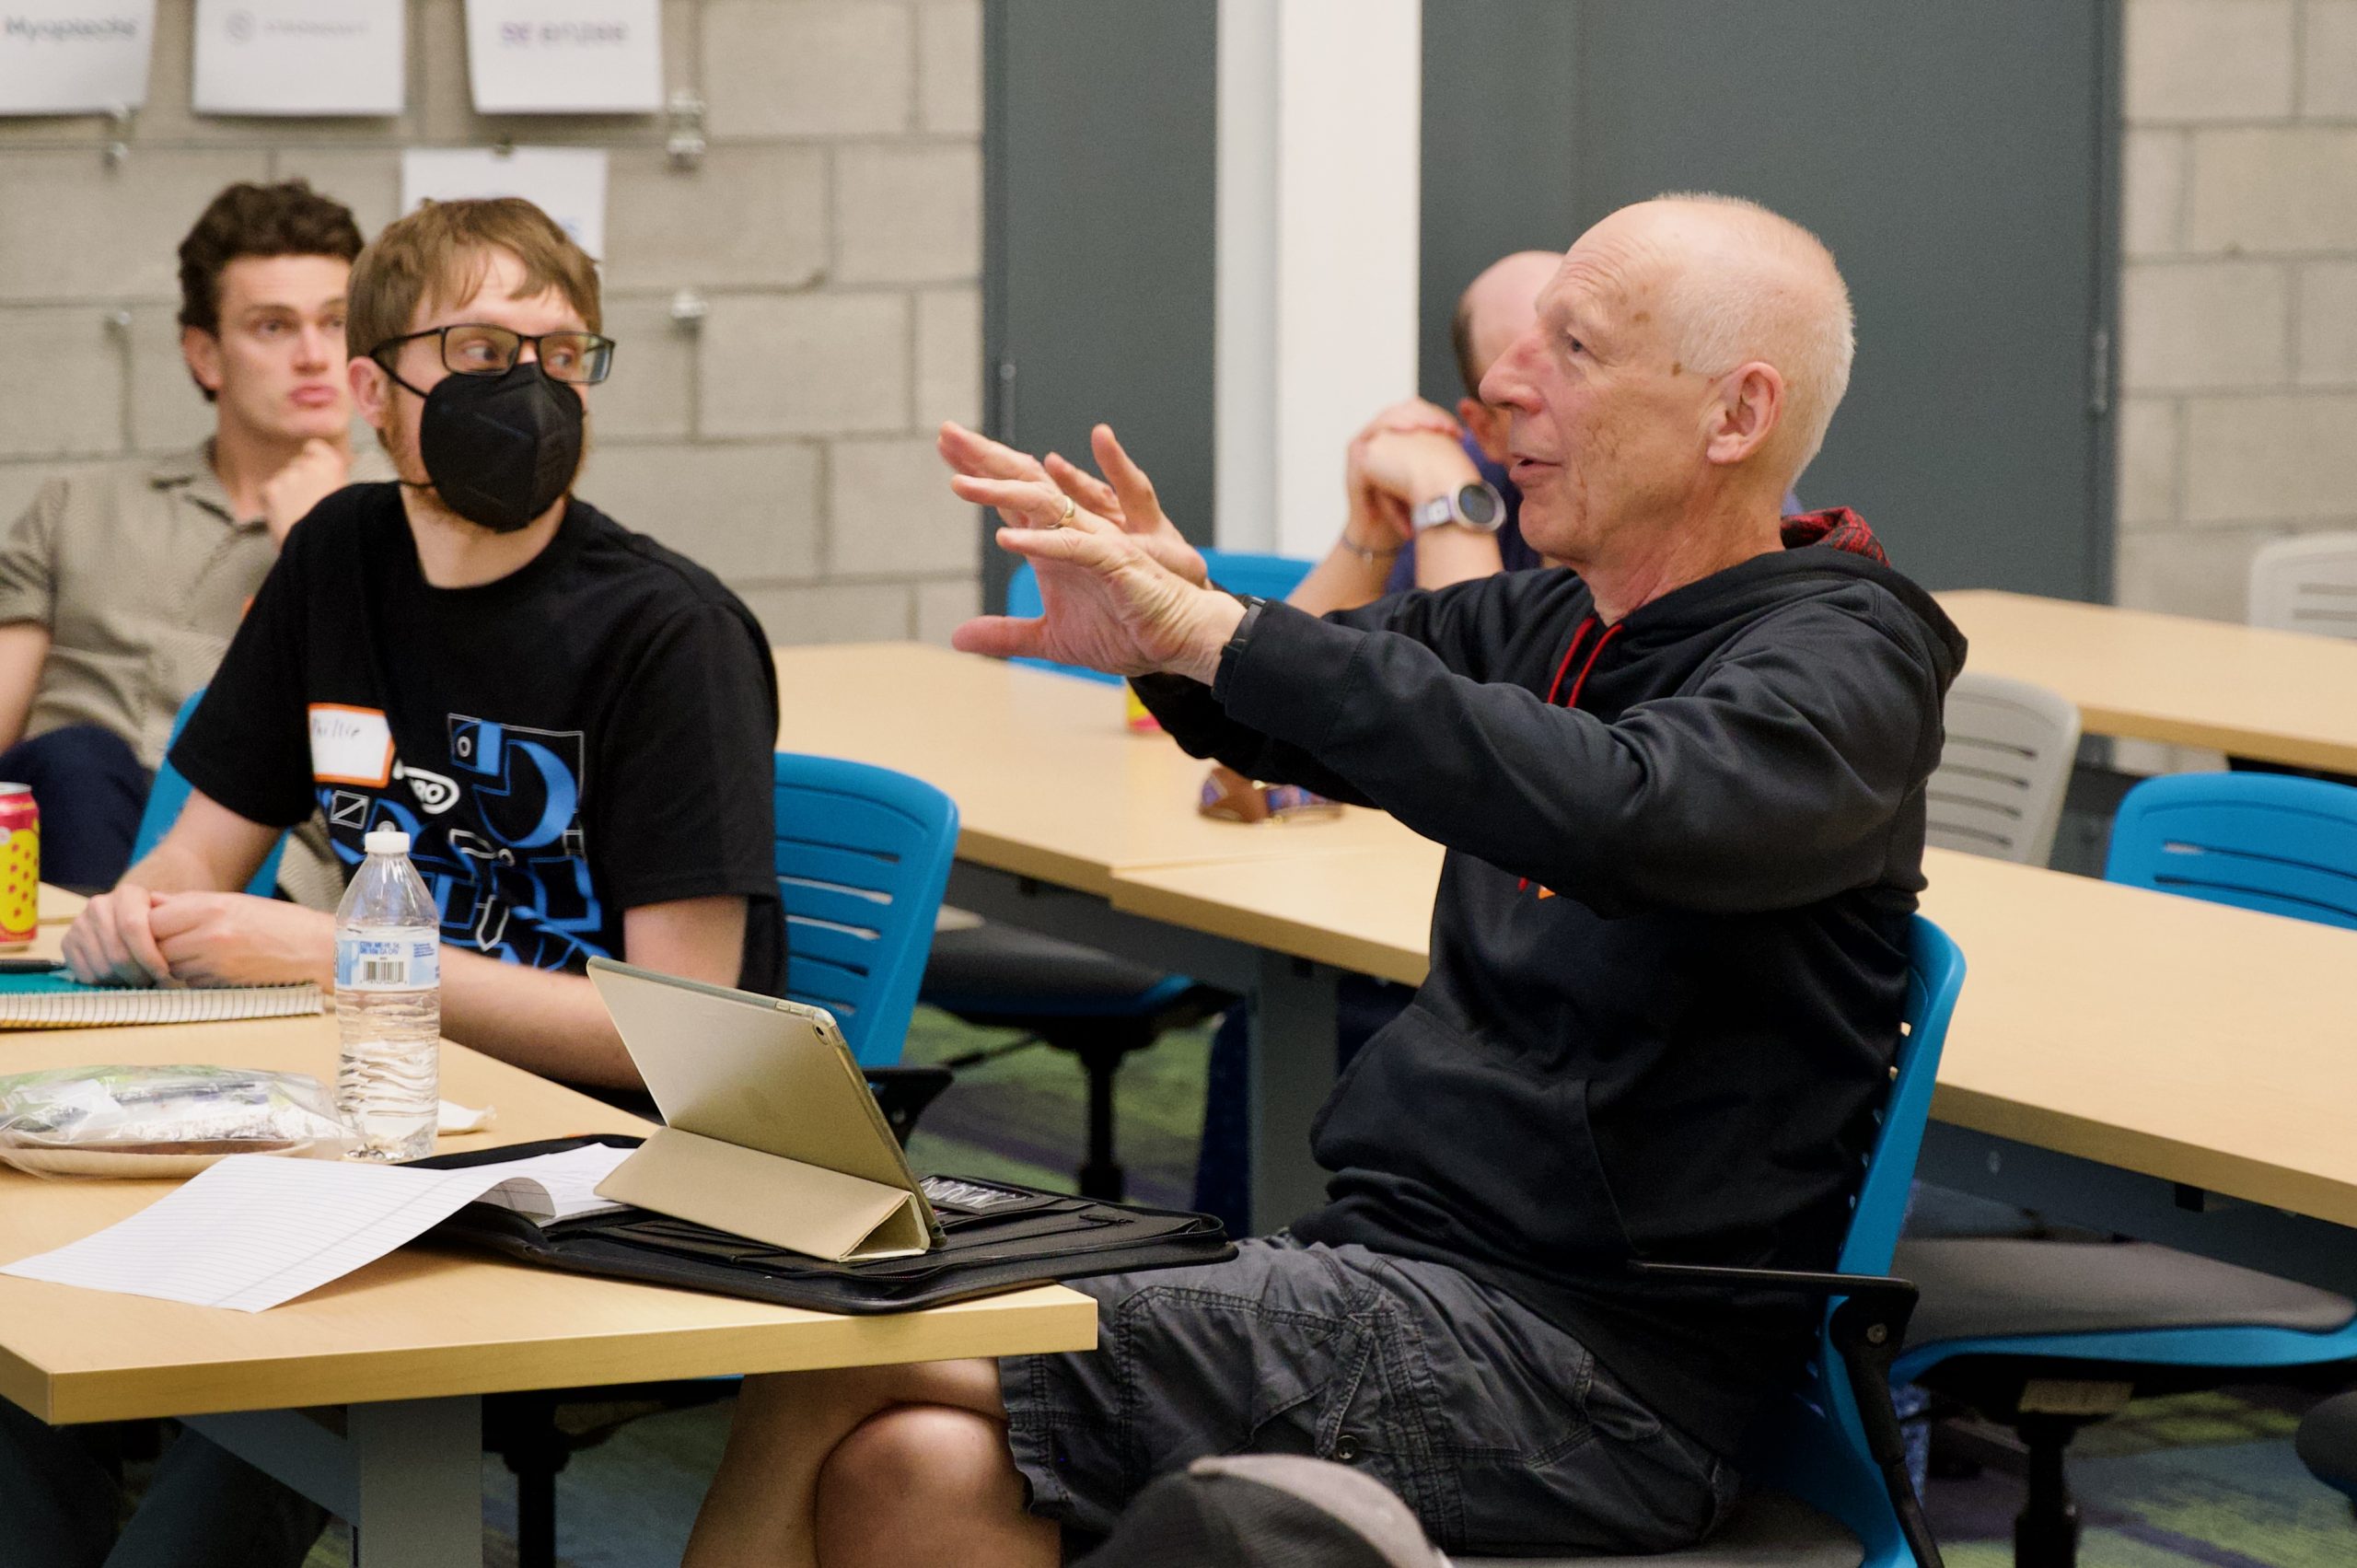
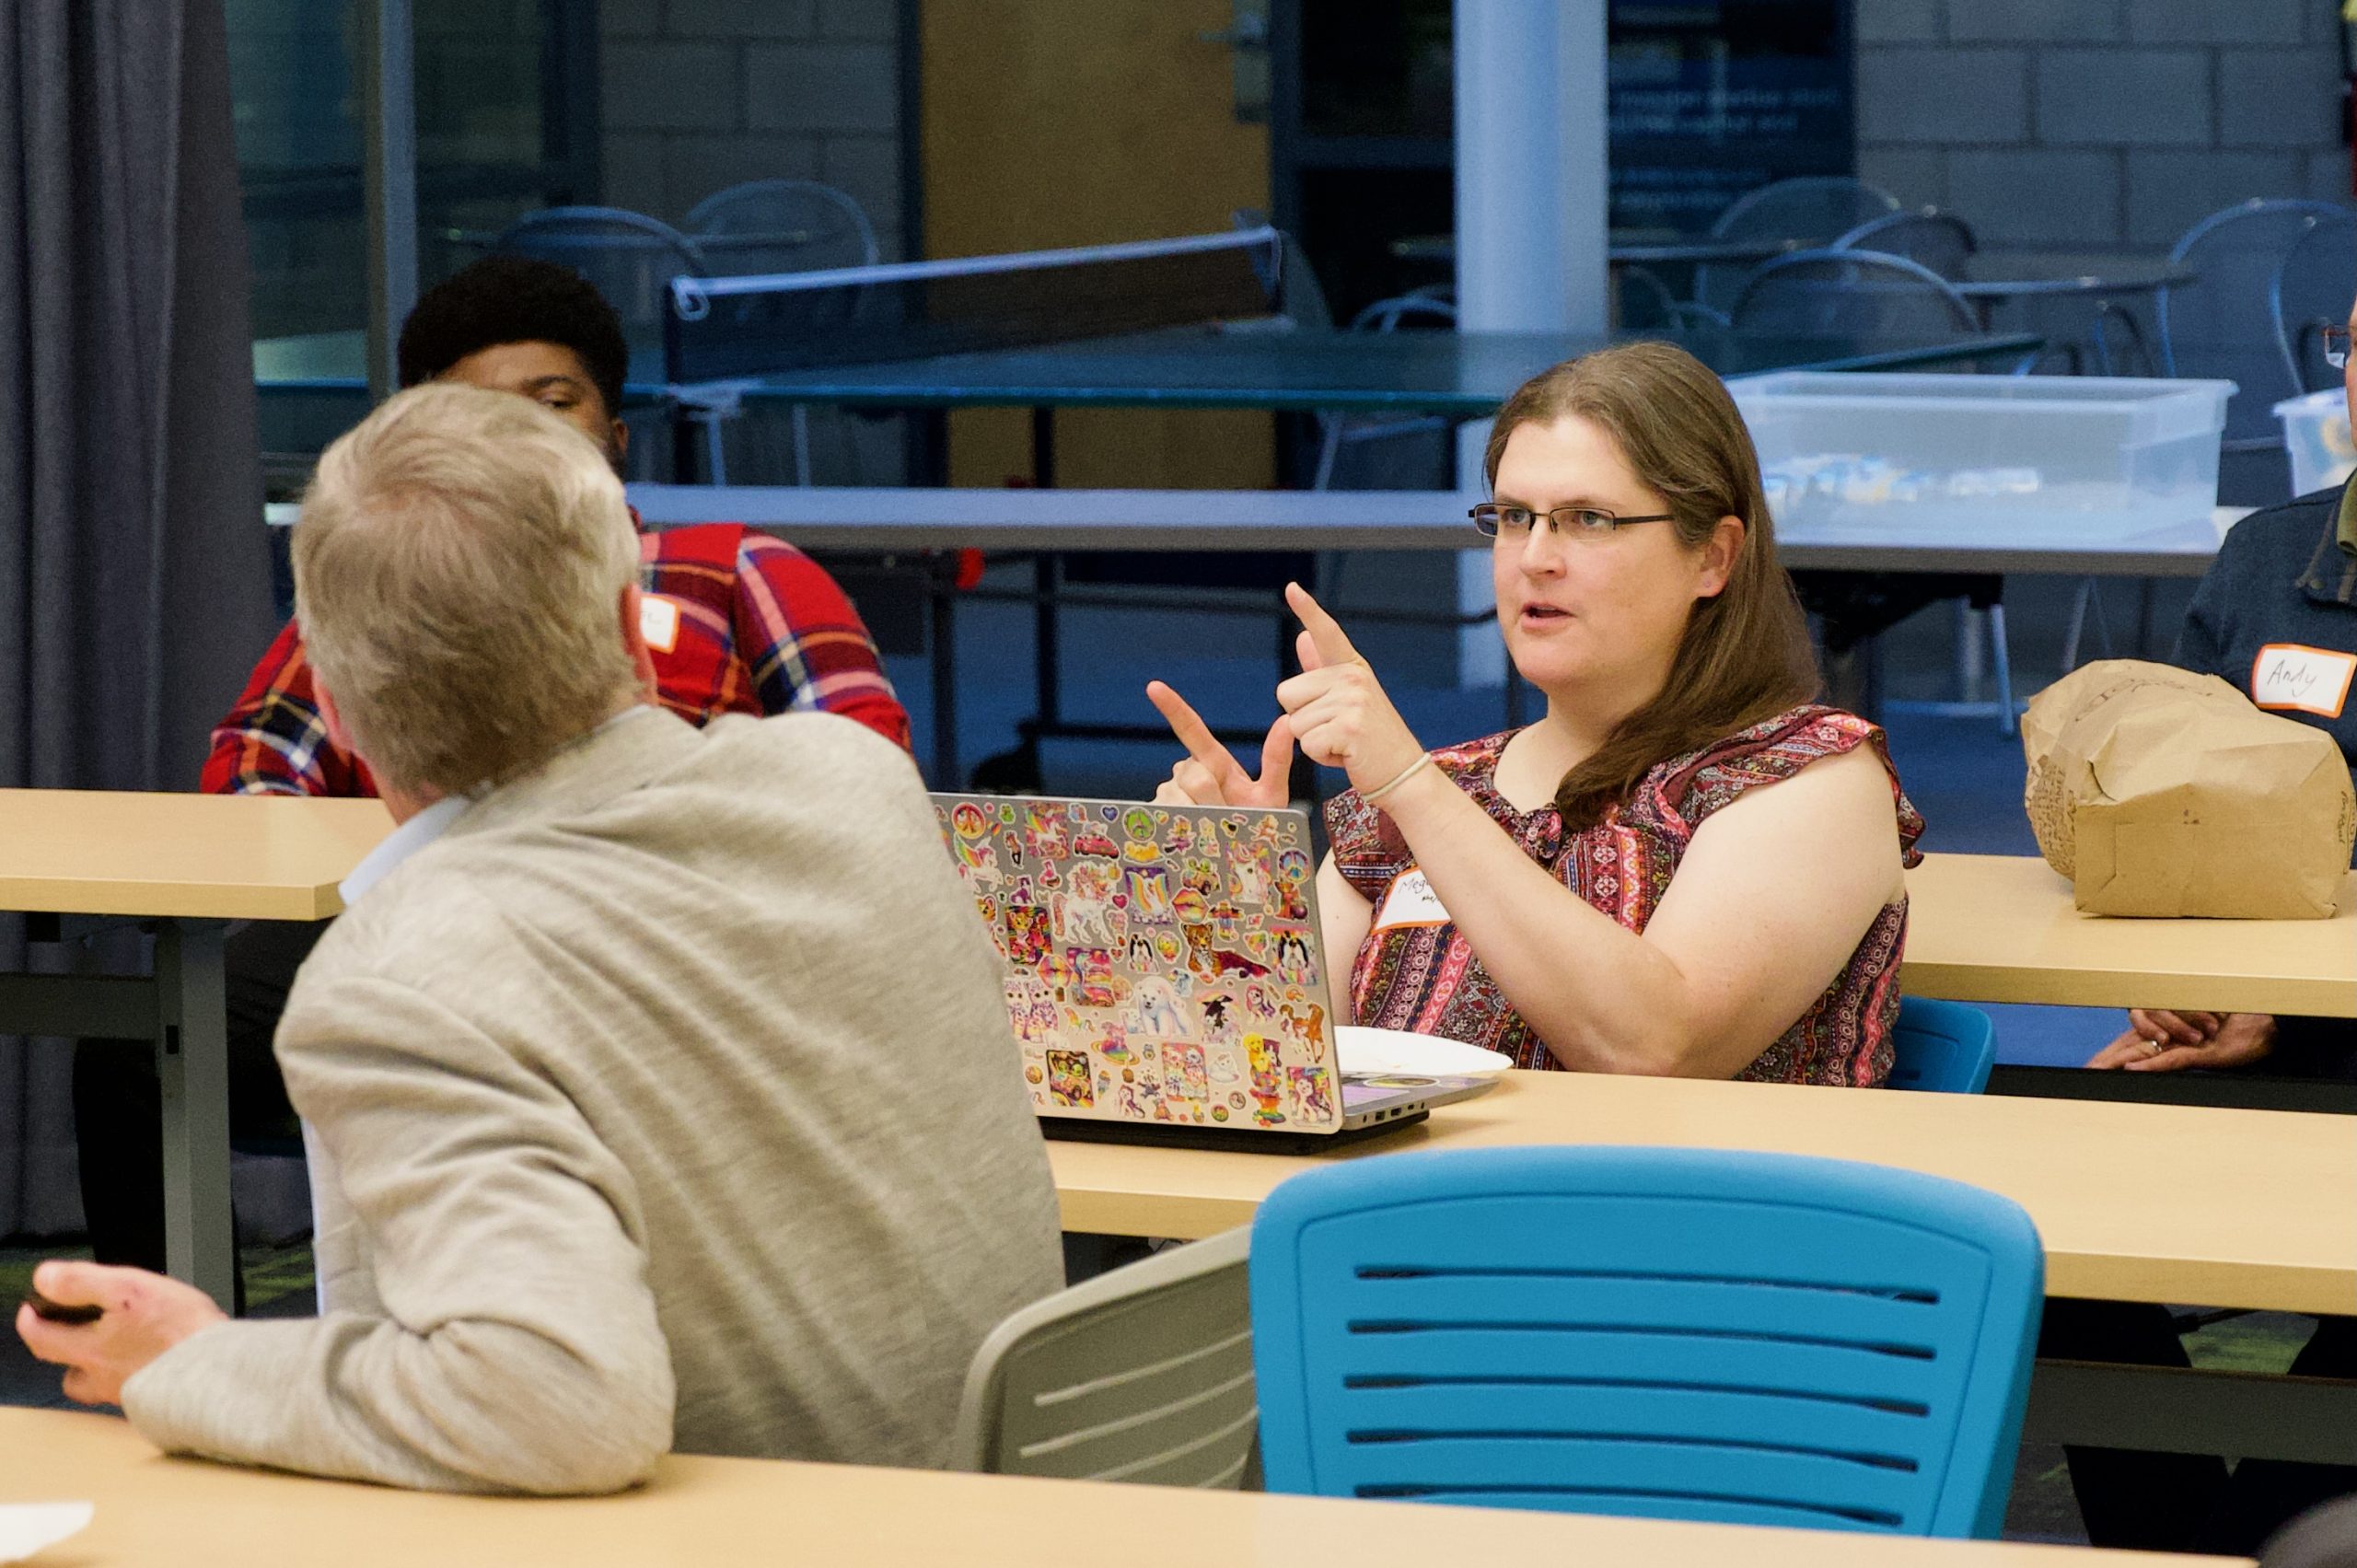
And, of course, some pictures!