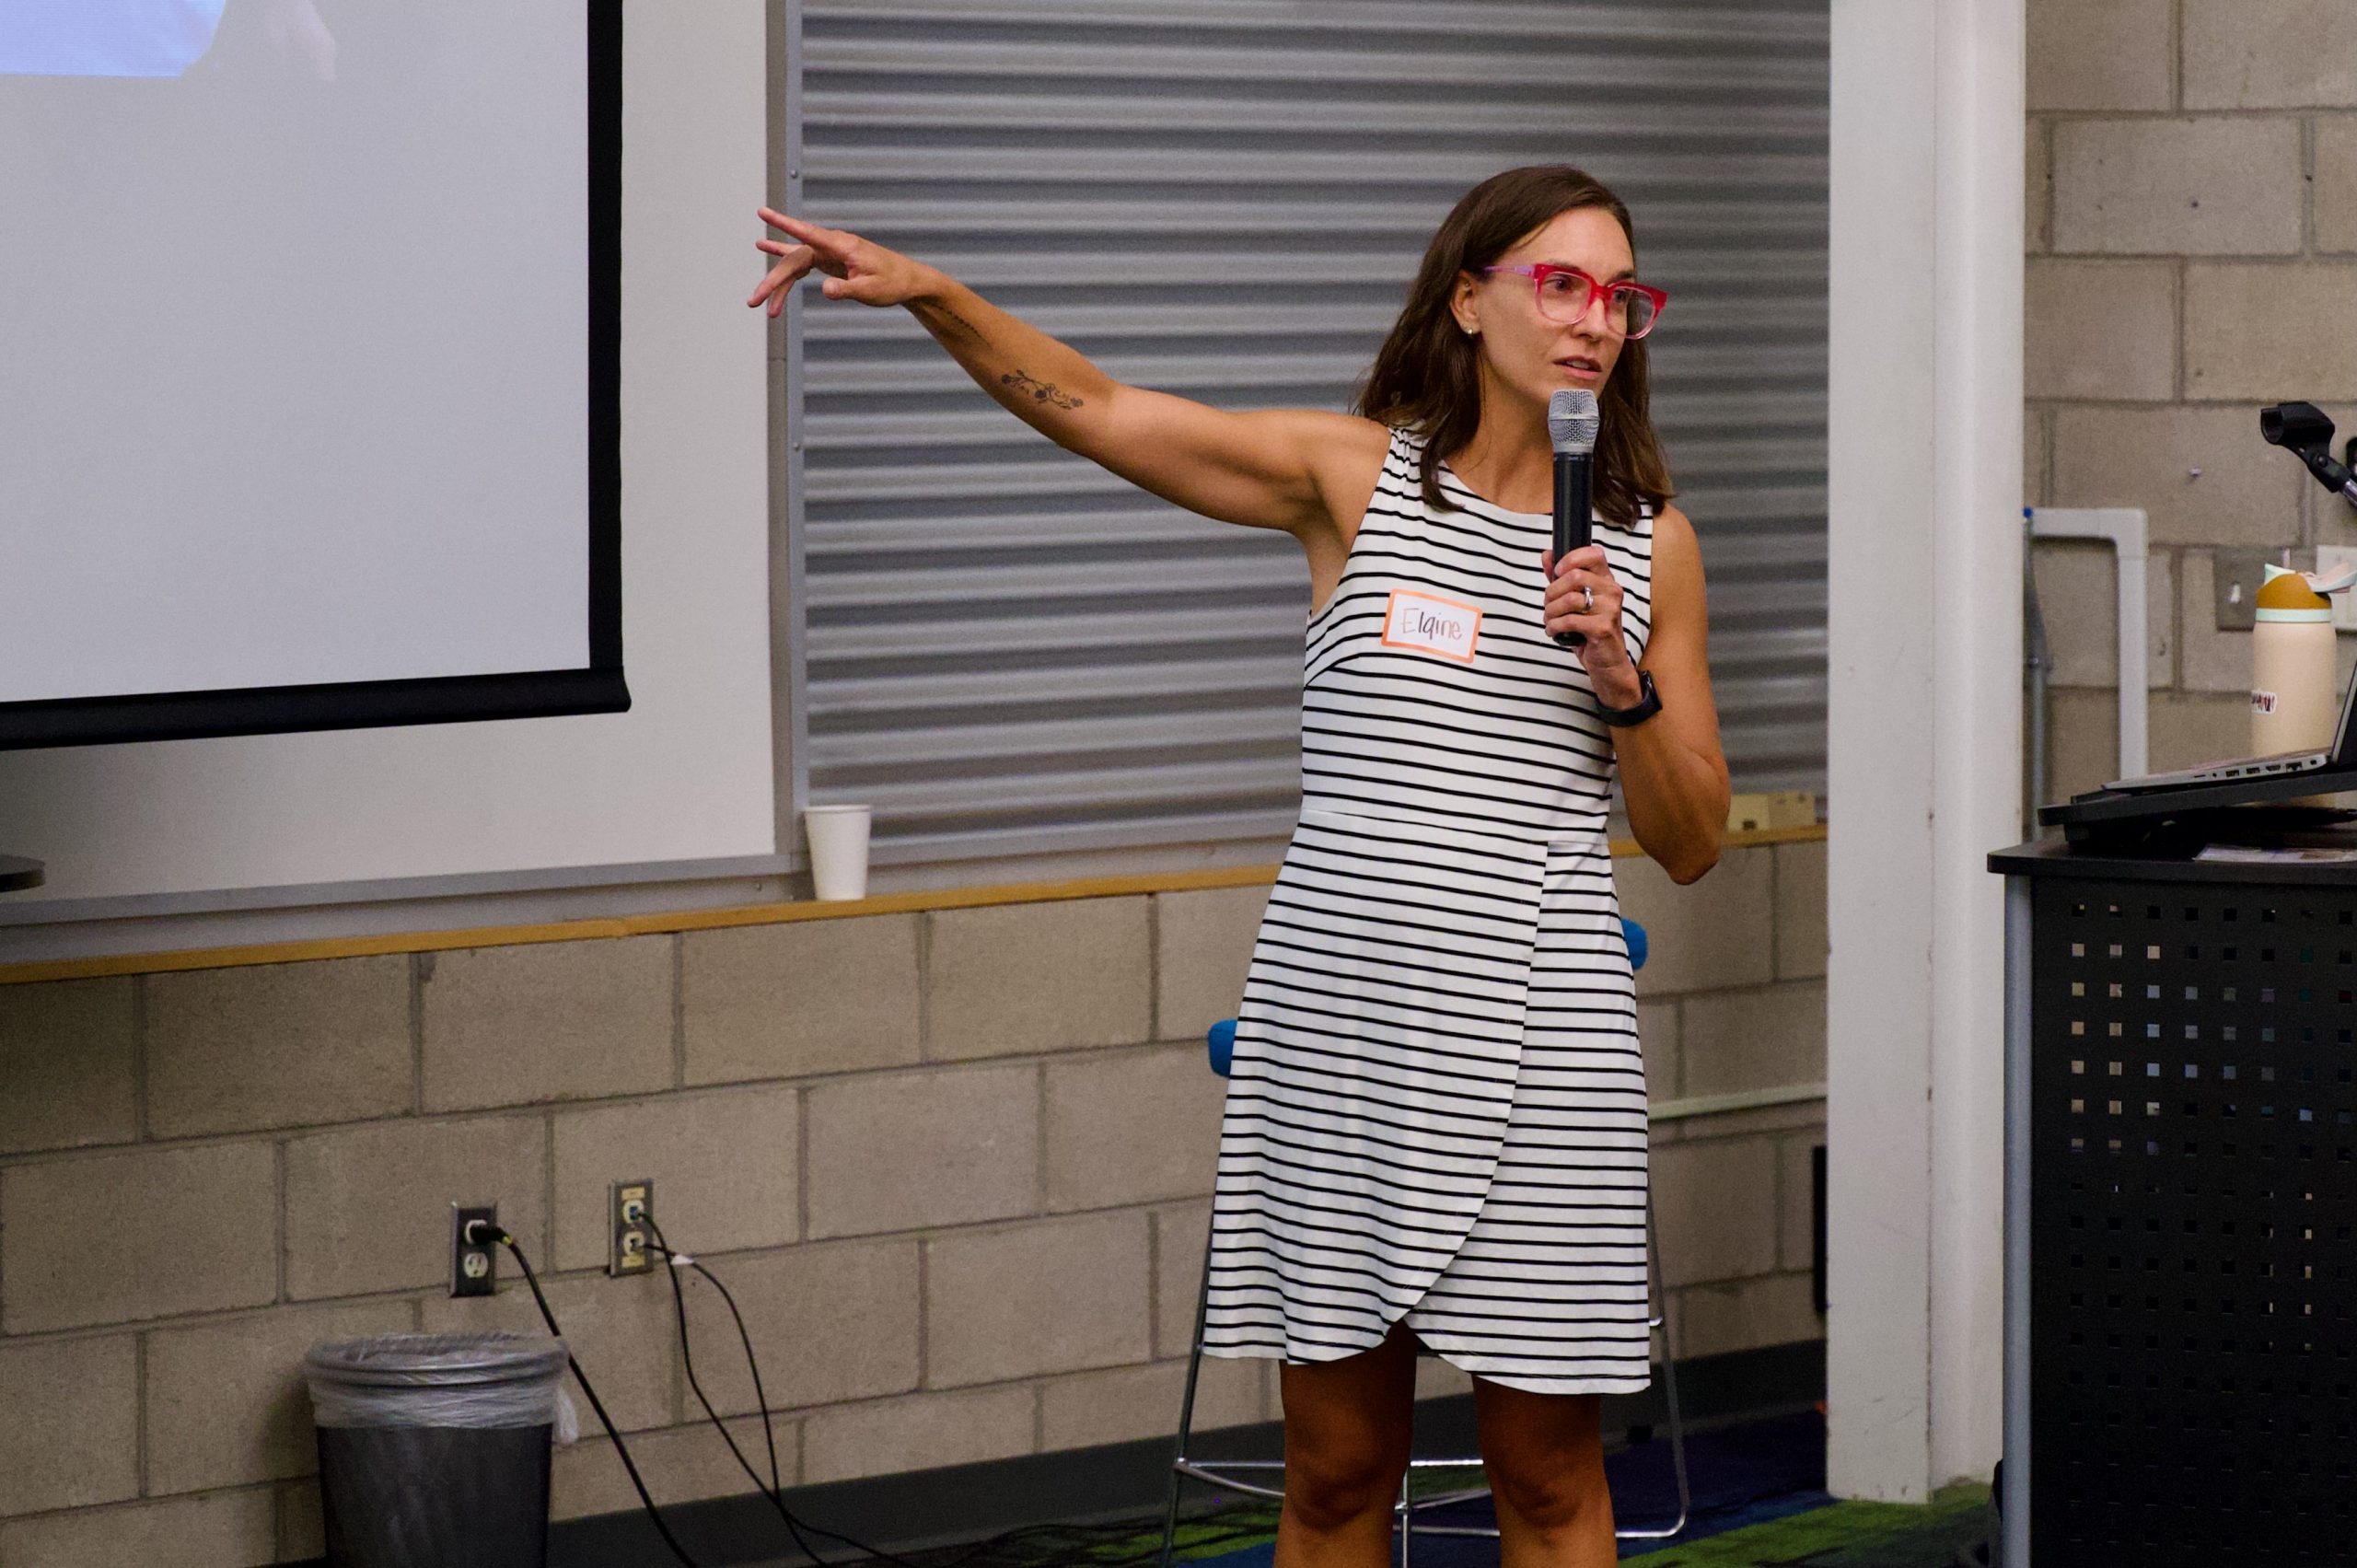
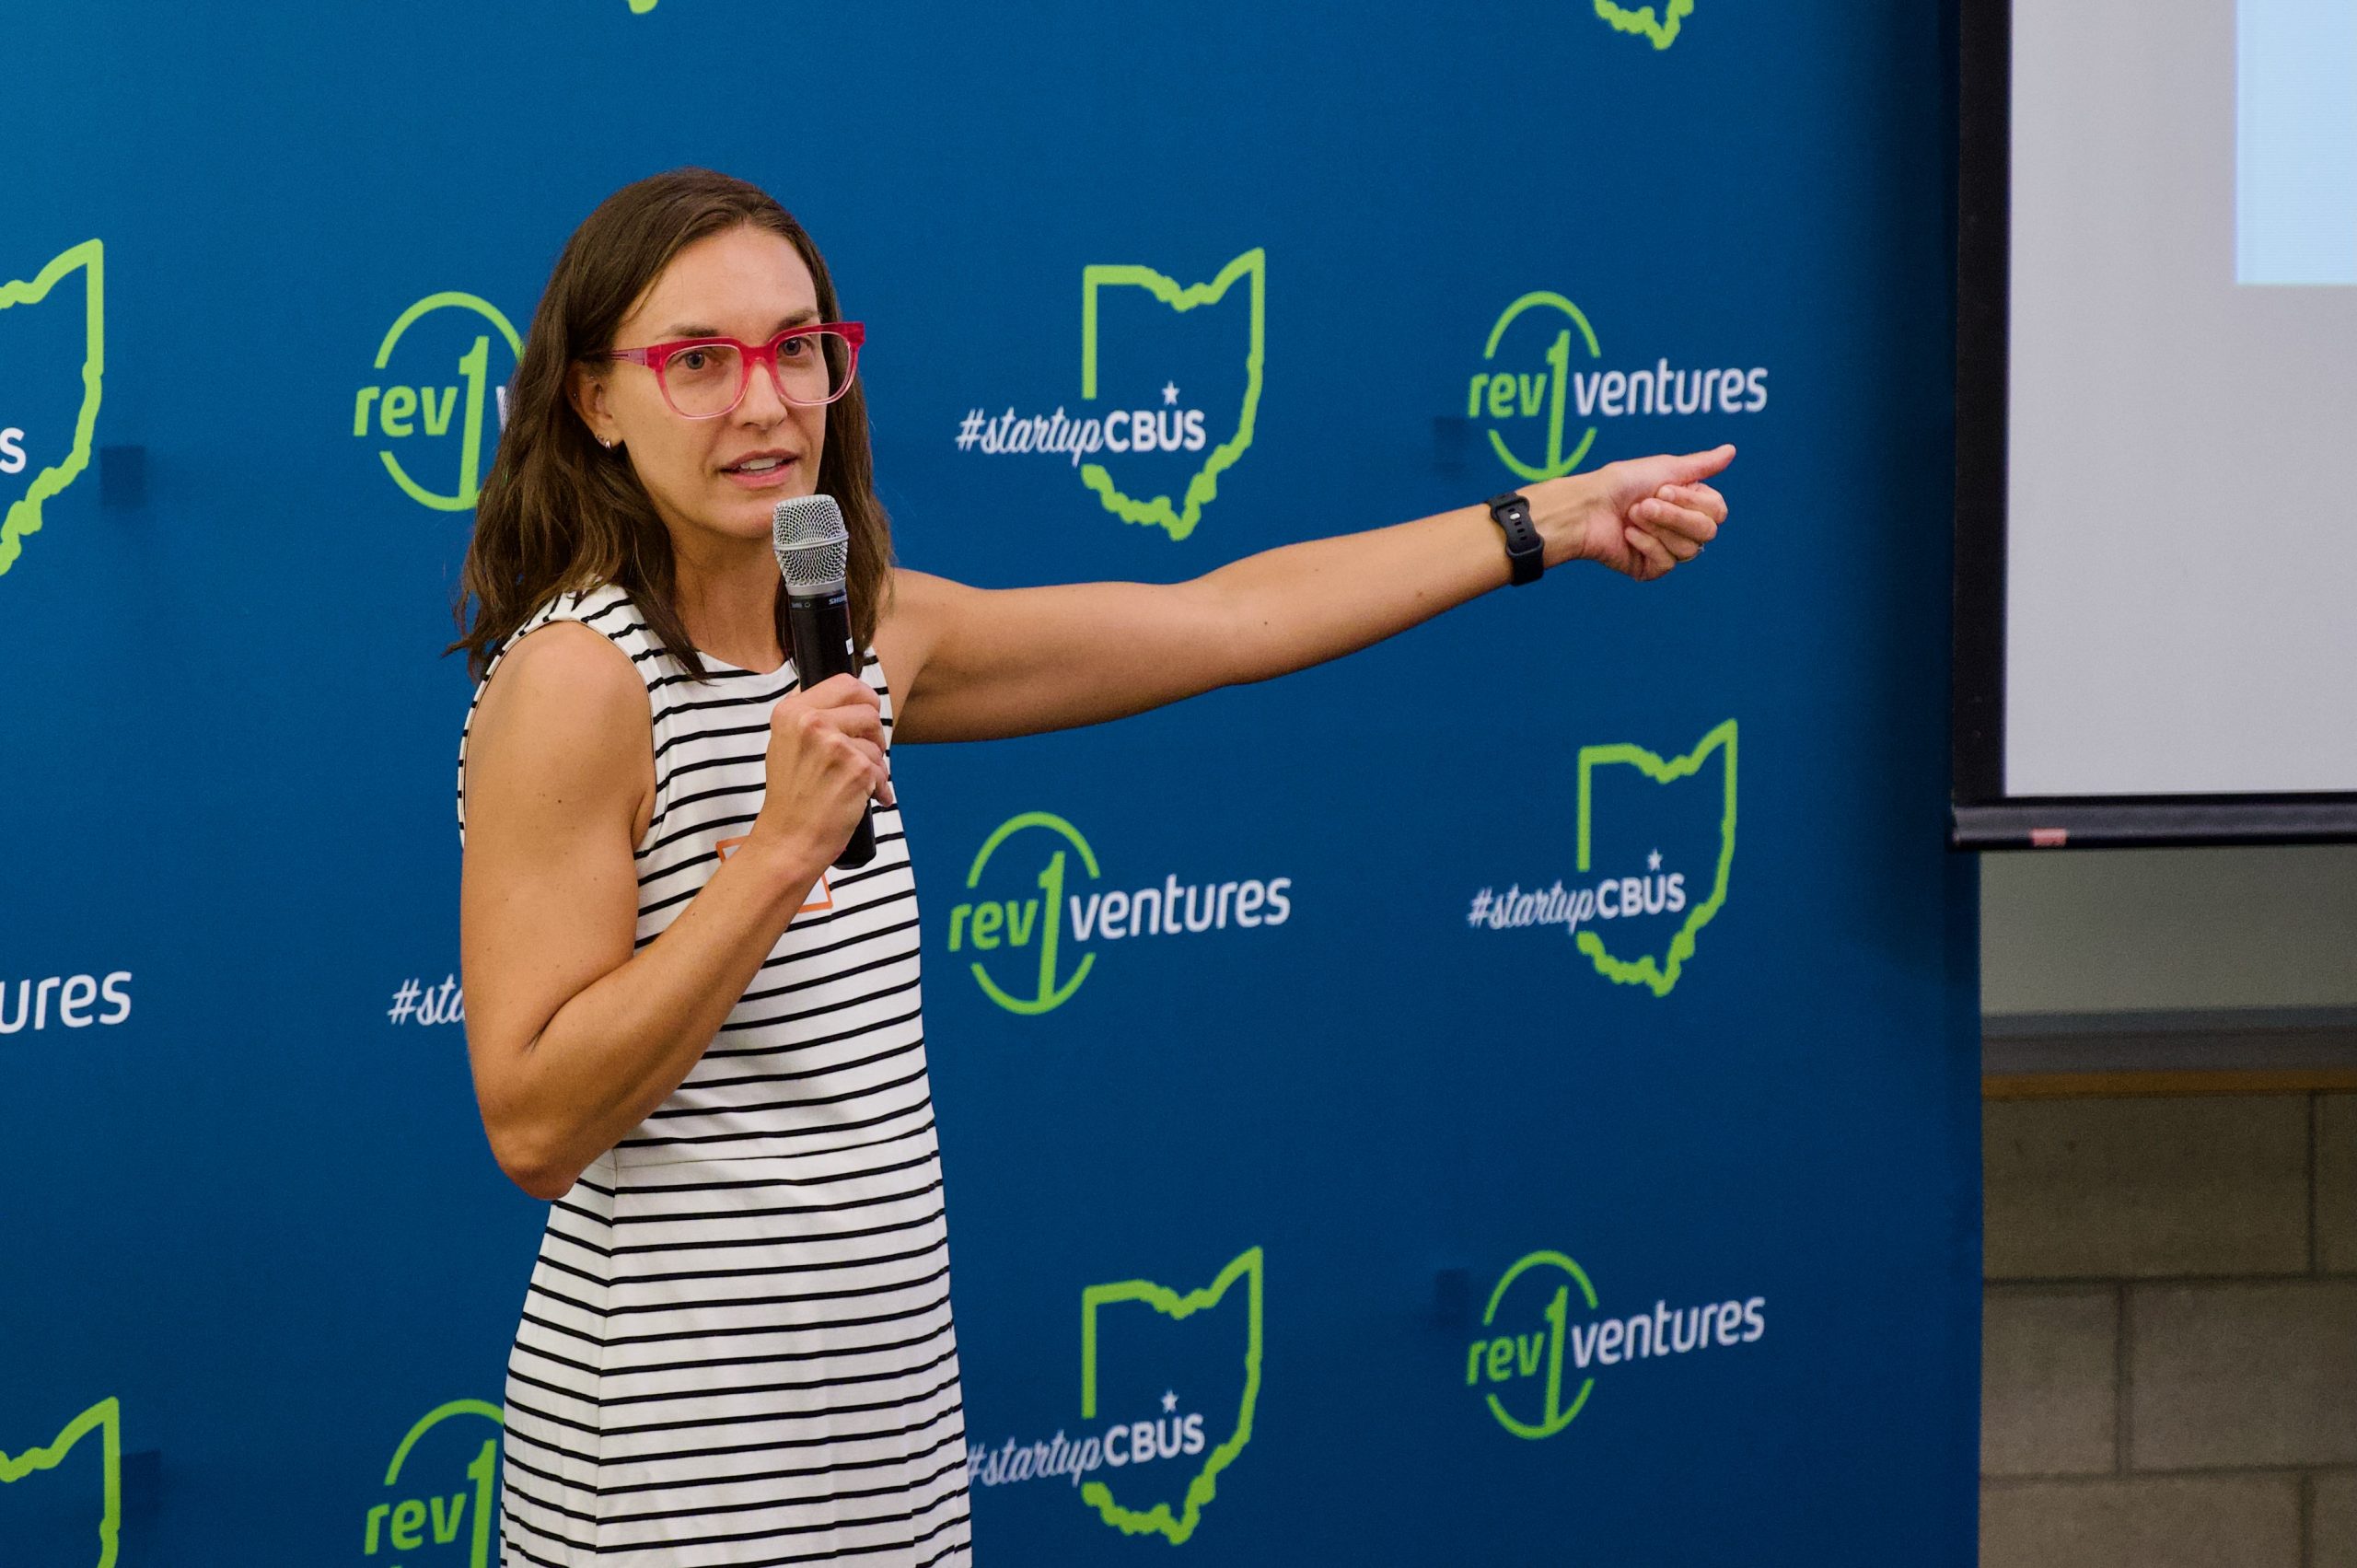
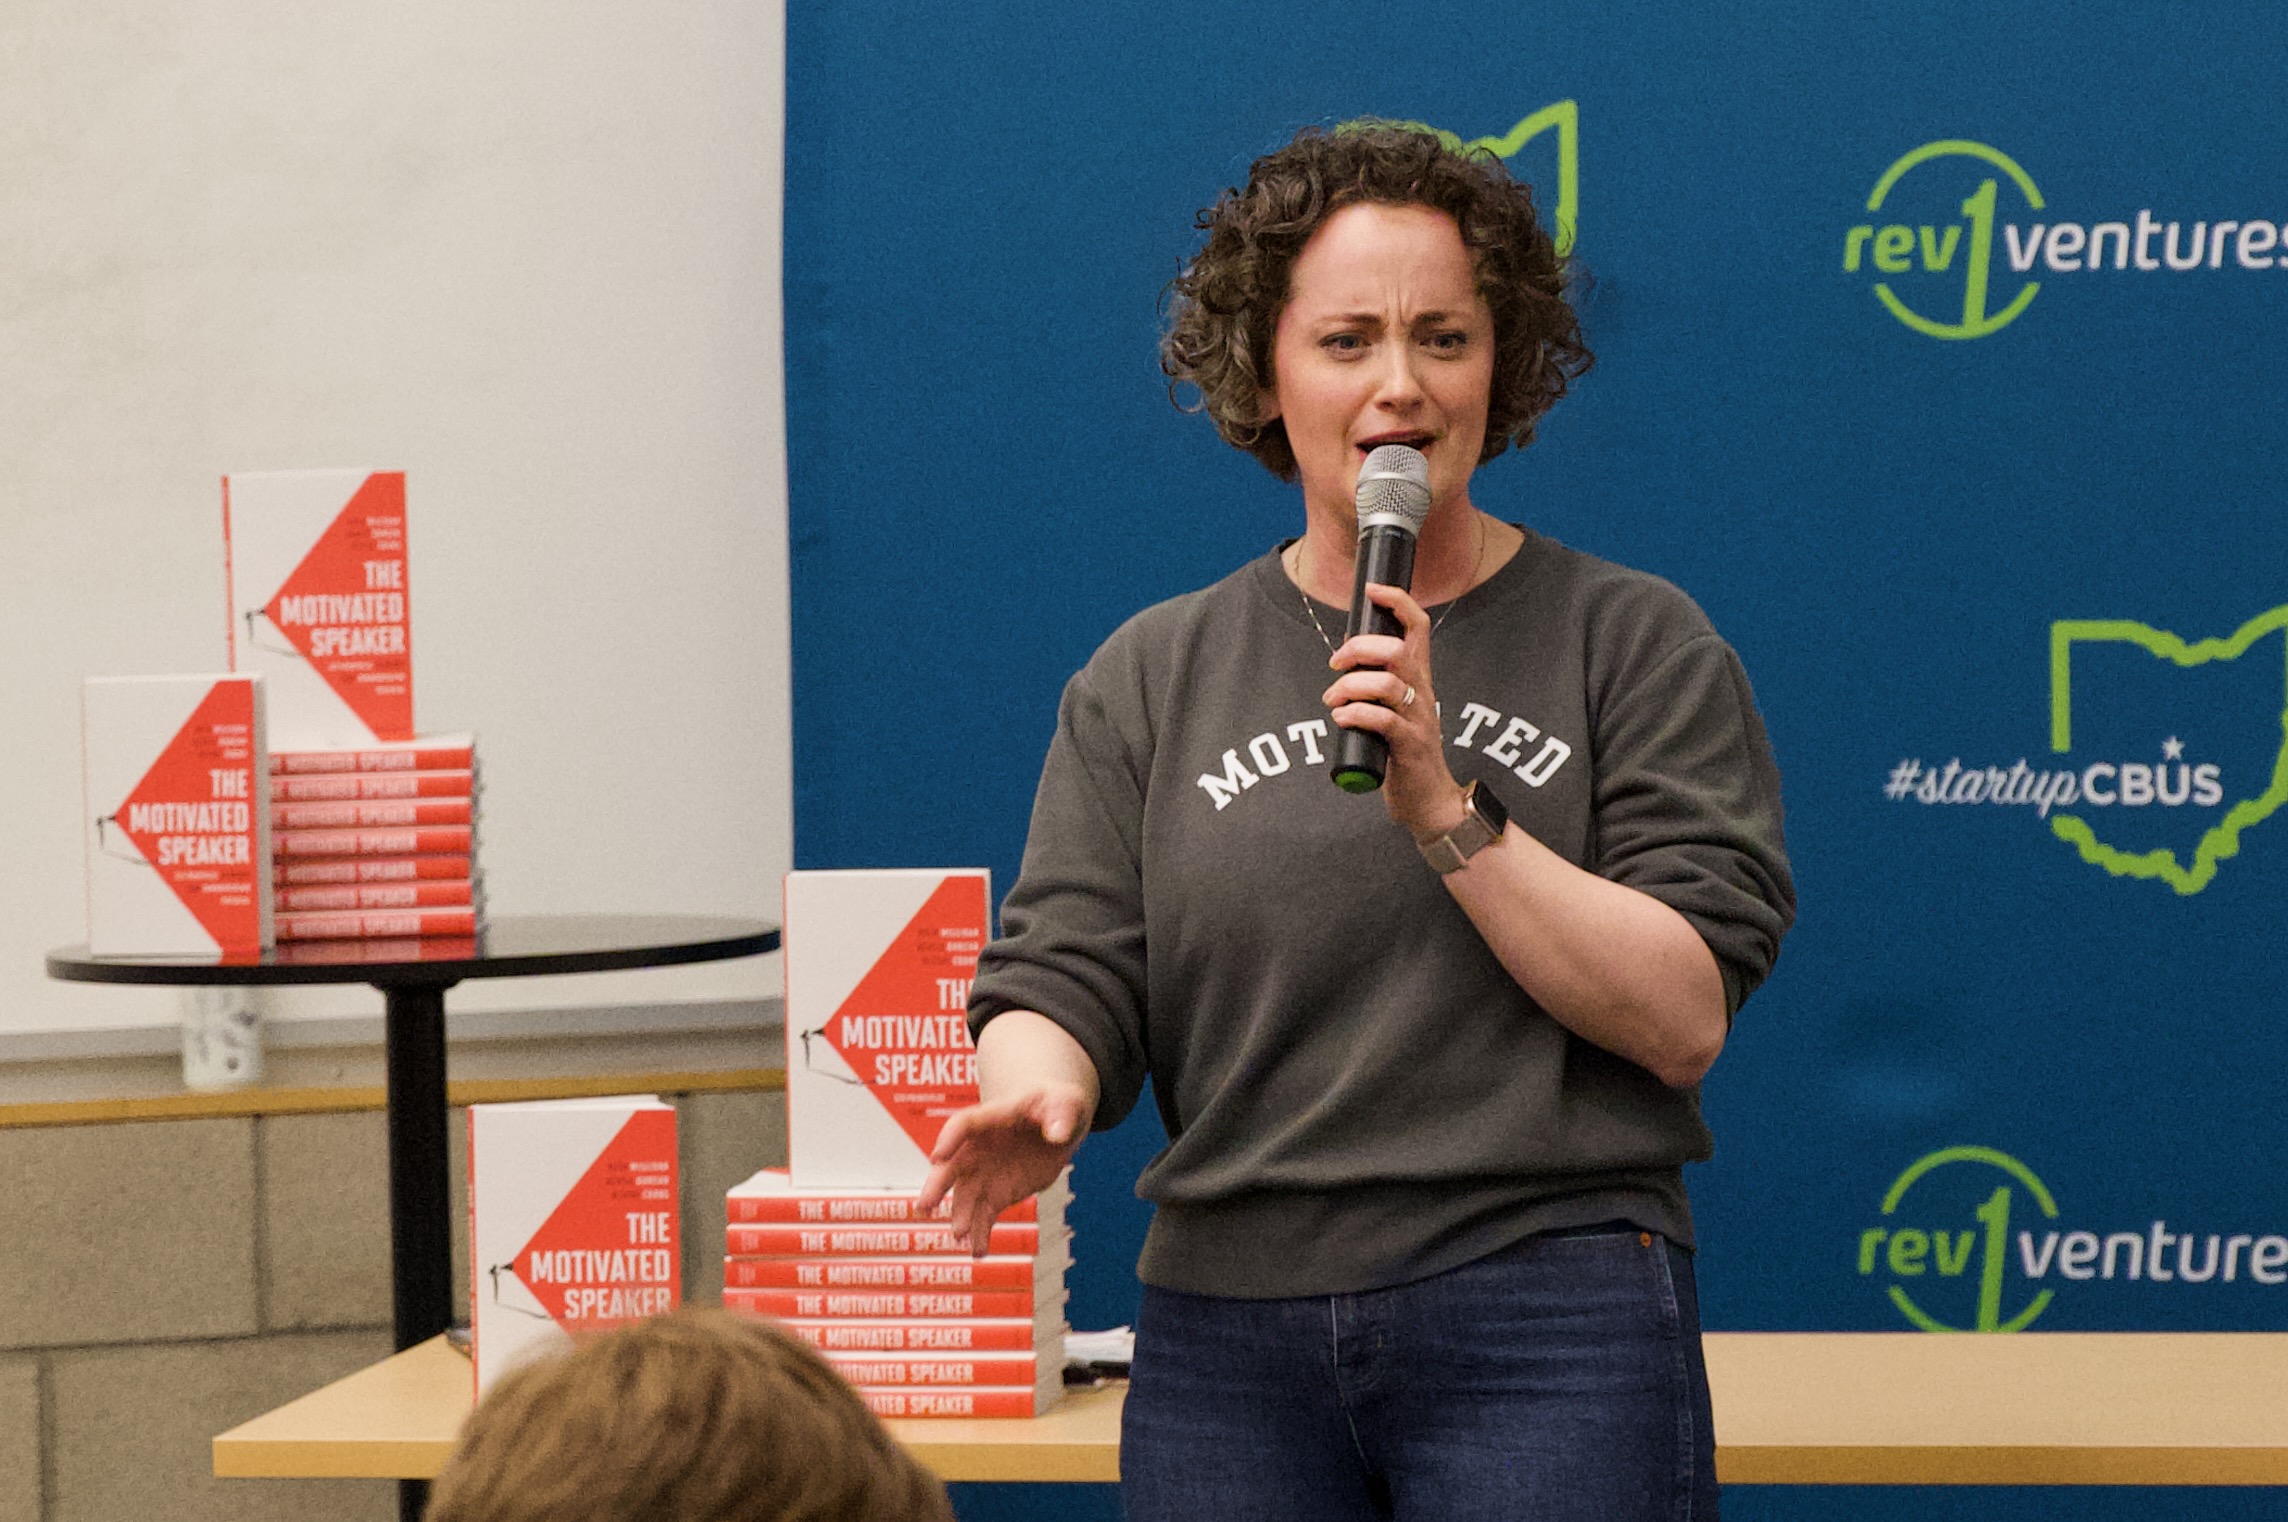
This month’s event featured a returning champion: Elaine Armbruster from the American Diabetes Association. Elaine last spoke at the meetup in August 2017 when she worked for The Ohio State University (more on that in a bit).
Her topic this time was how and why it’s important to not only stay curious (almost maniacally so? frenetically so?), but also to probe that curiosity and, perhaps most importantly, pursue that curiosity methodically with data. With experimentation (when possible)!
“But wait!” you may be thinking. “If you’re going to throw around words like ‘maniacal’ and ‘frenetic,’ how does all this curiosity not lead to analytical and experimentation chaos‽” Curiosity did, as we all know, kill the cat!
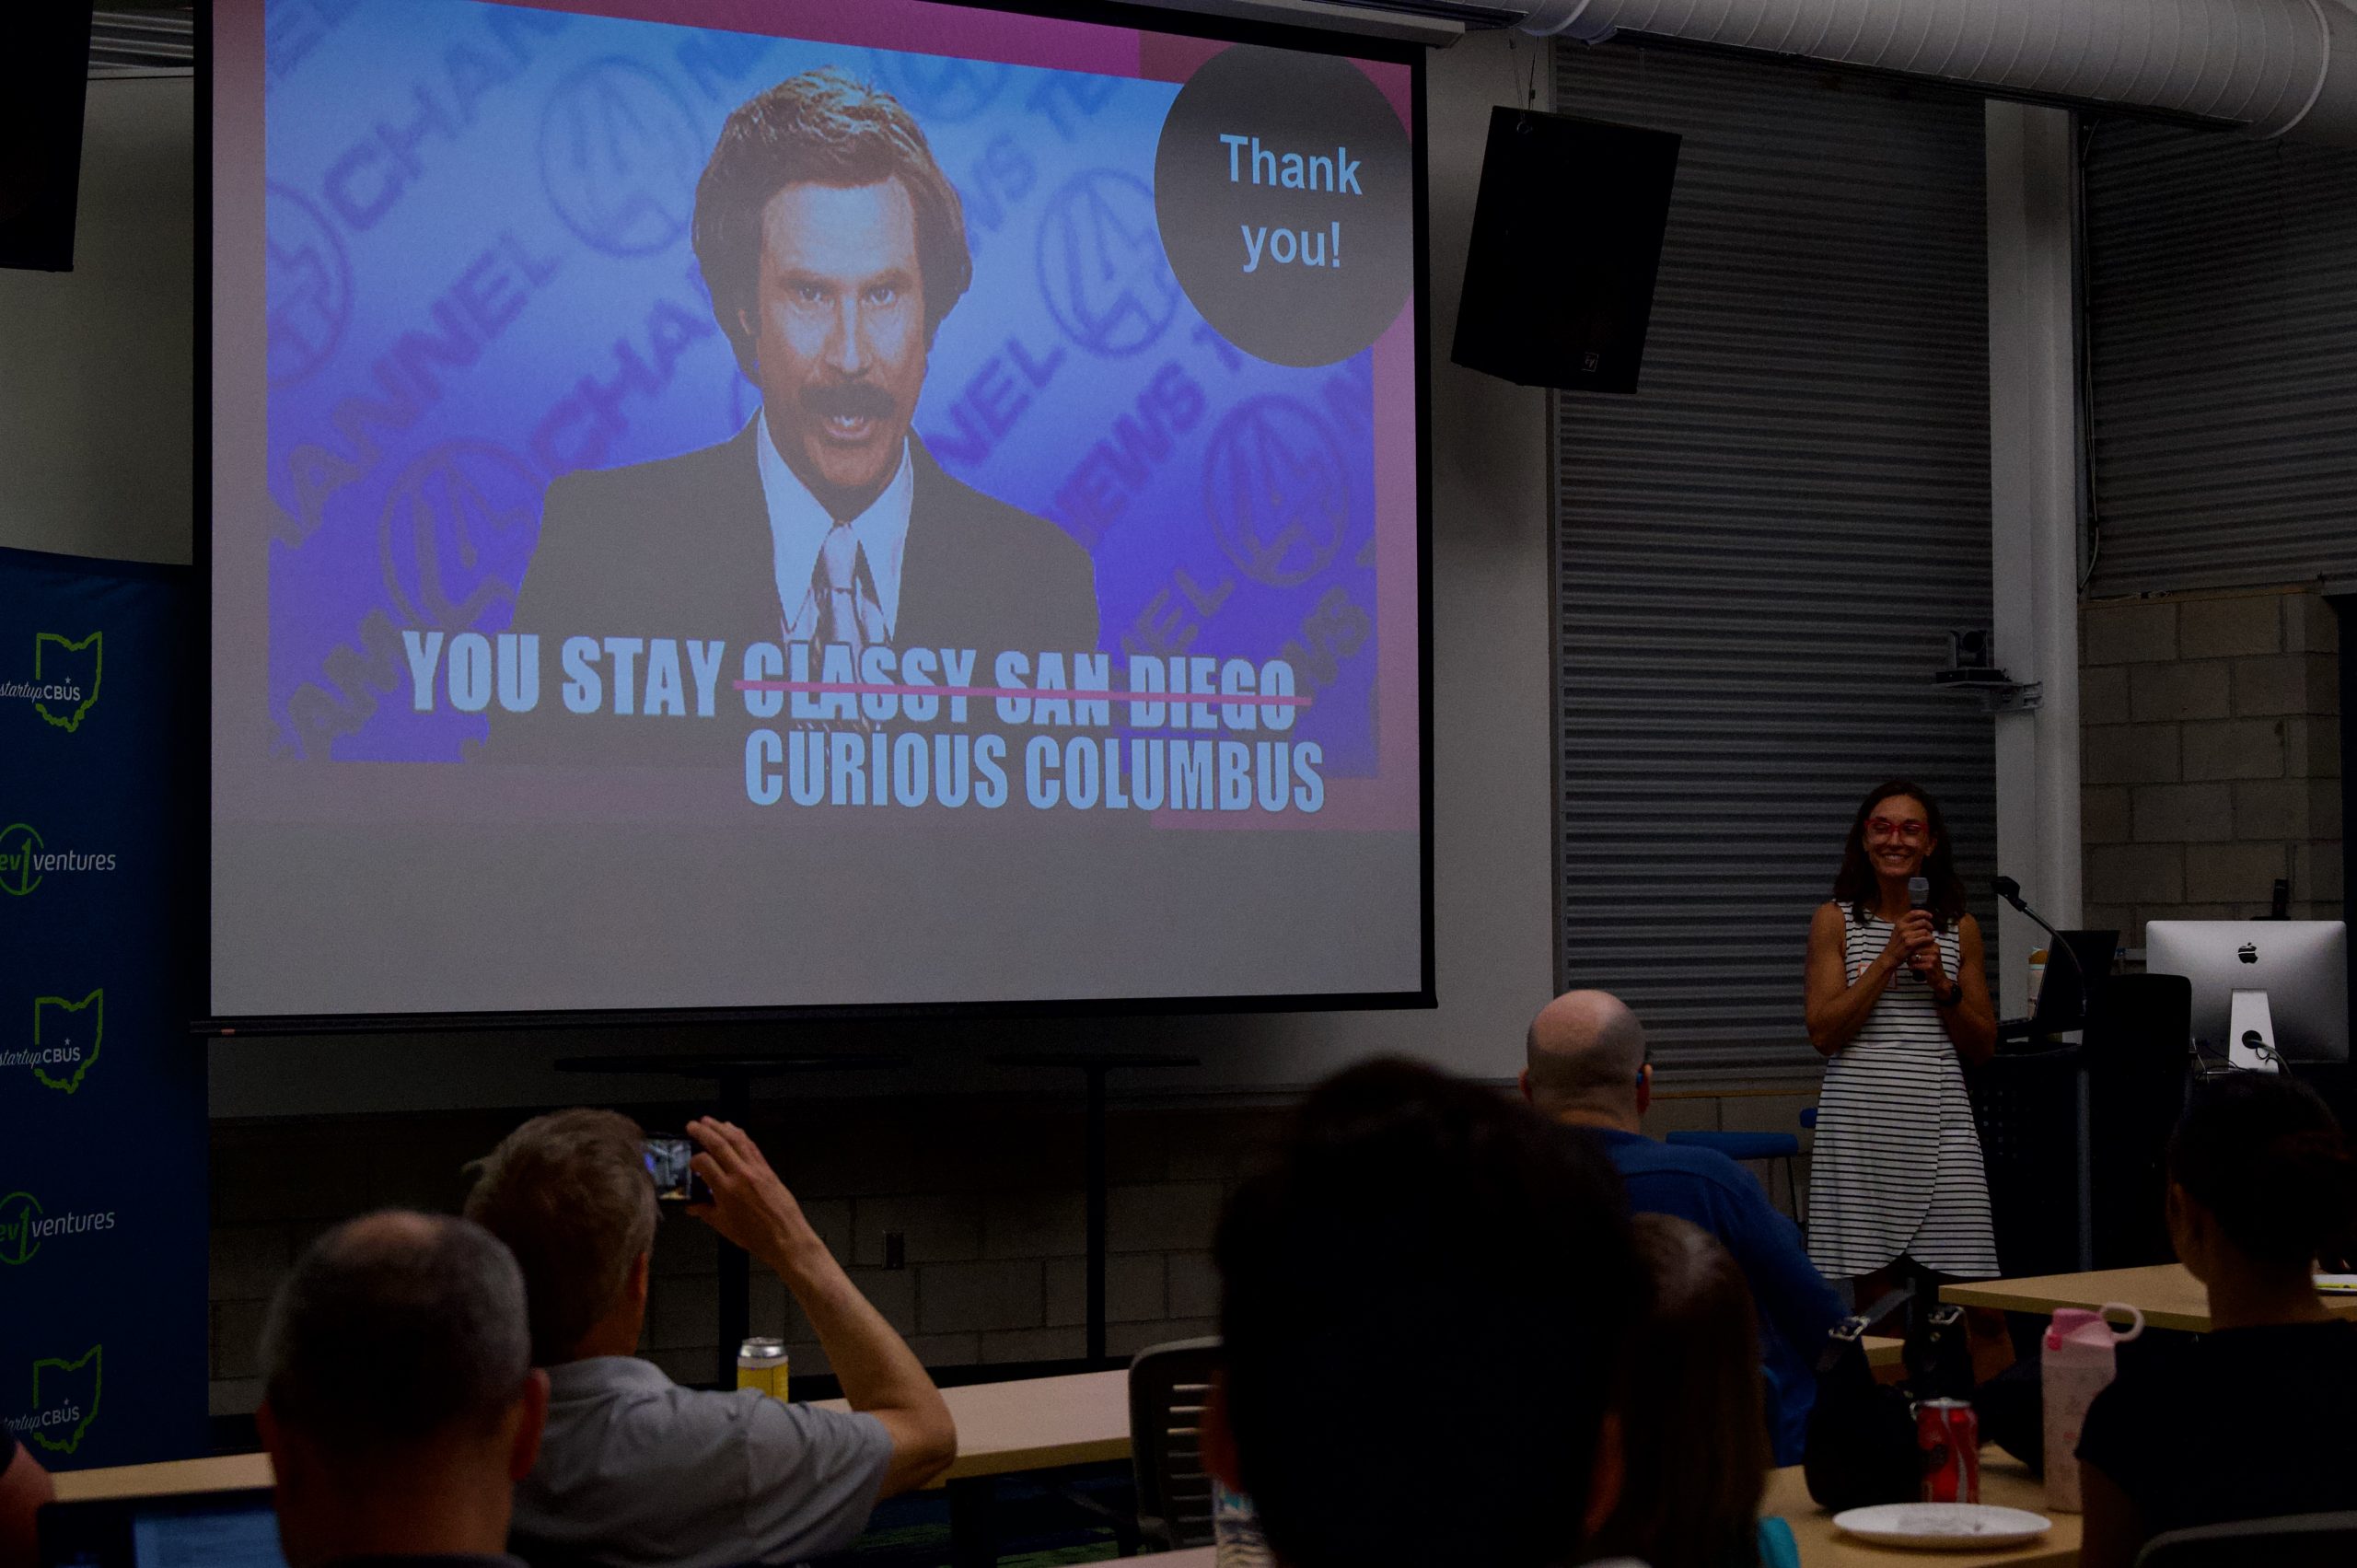
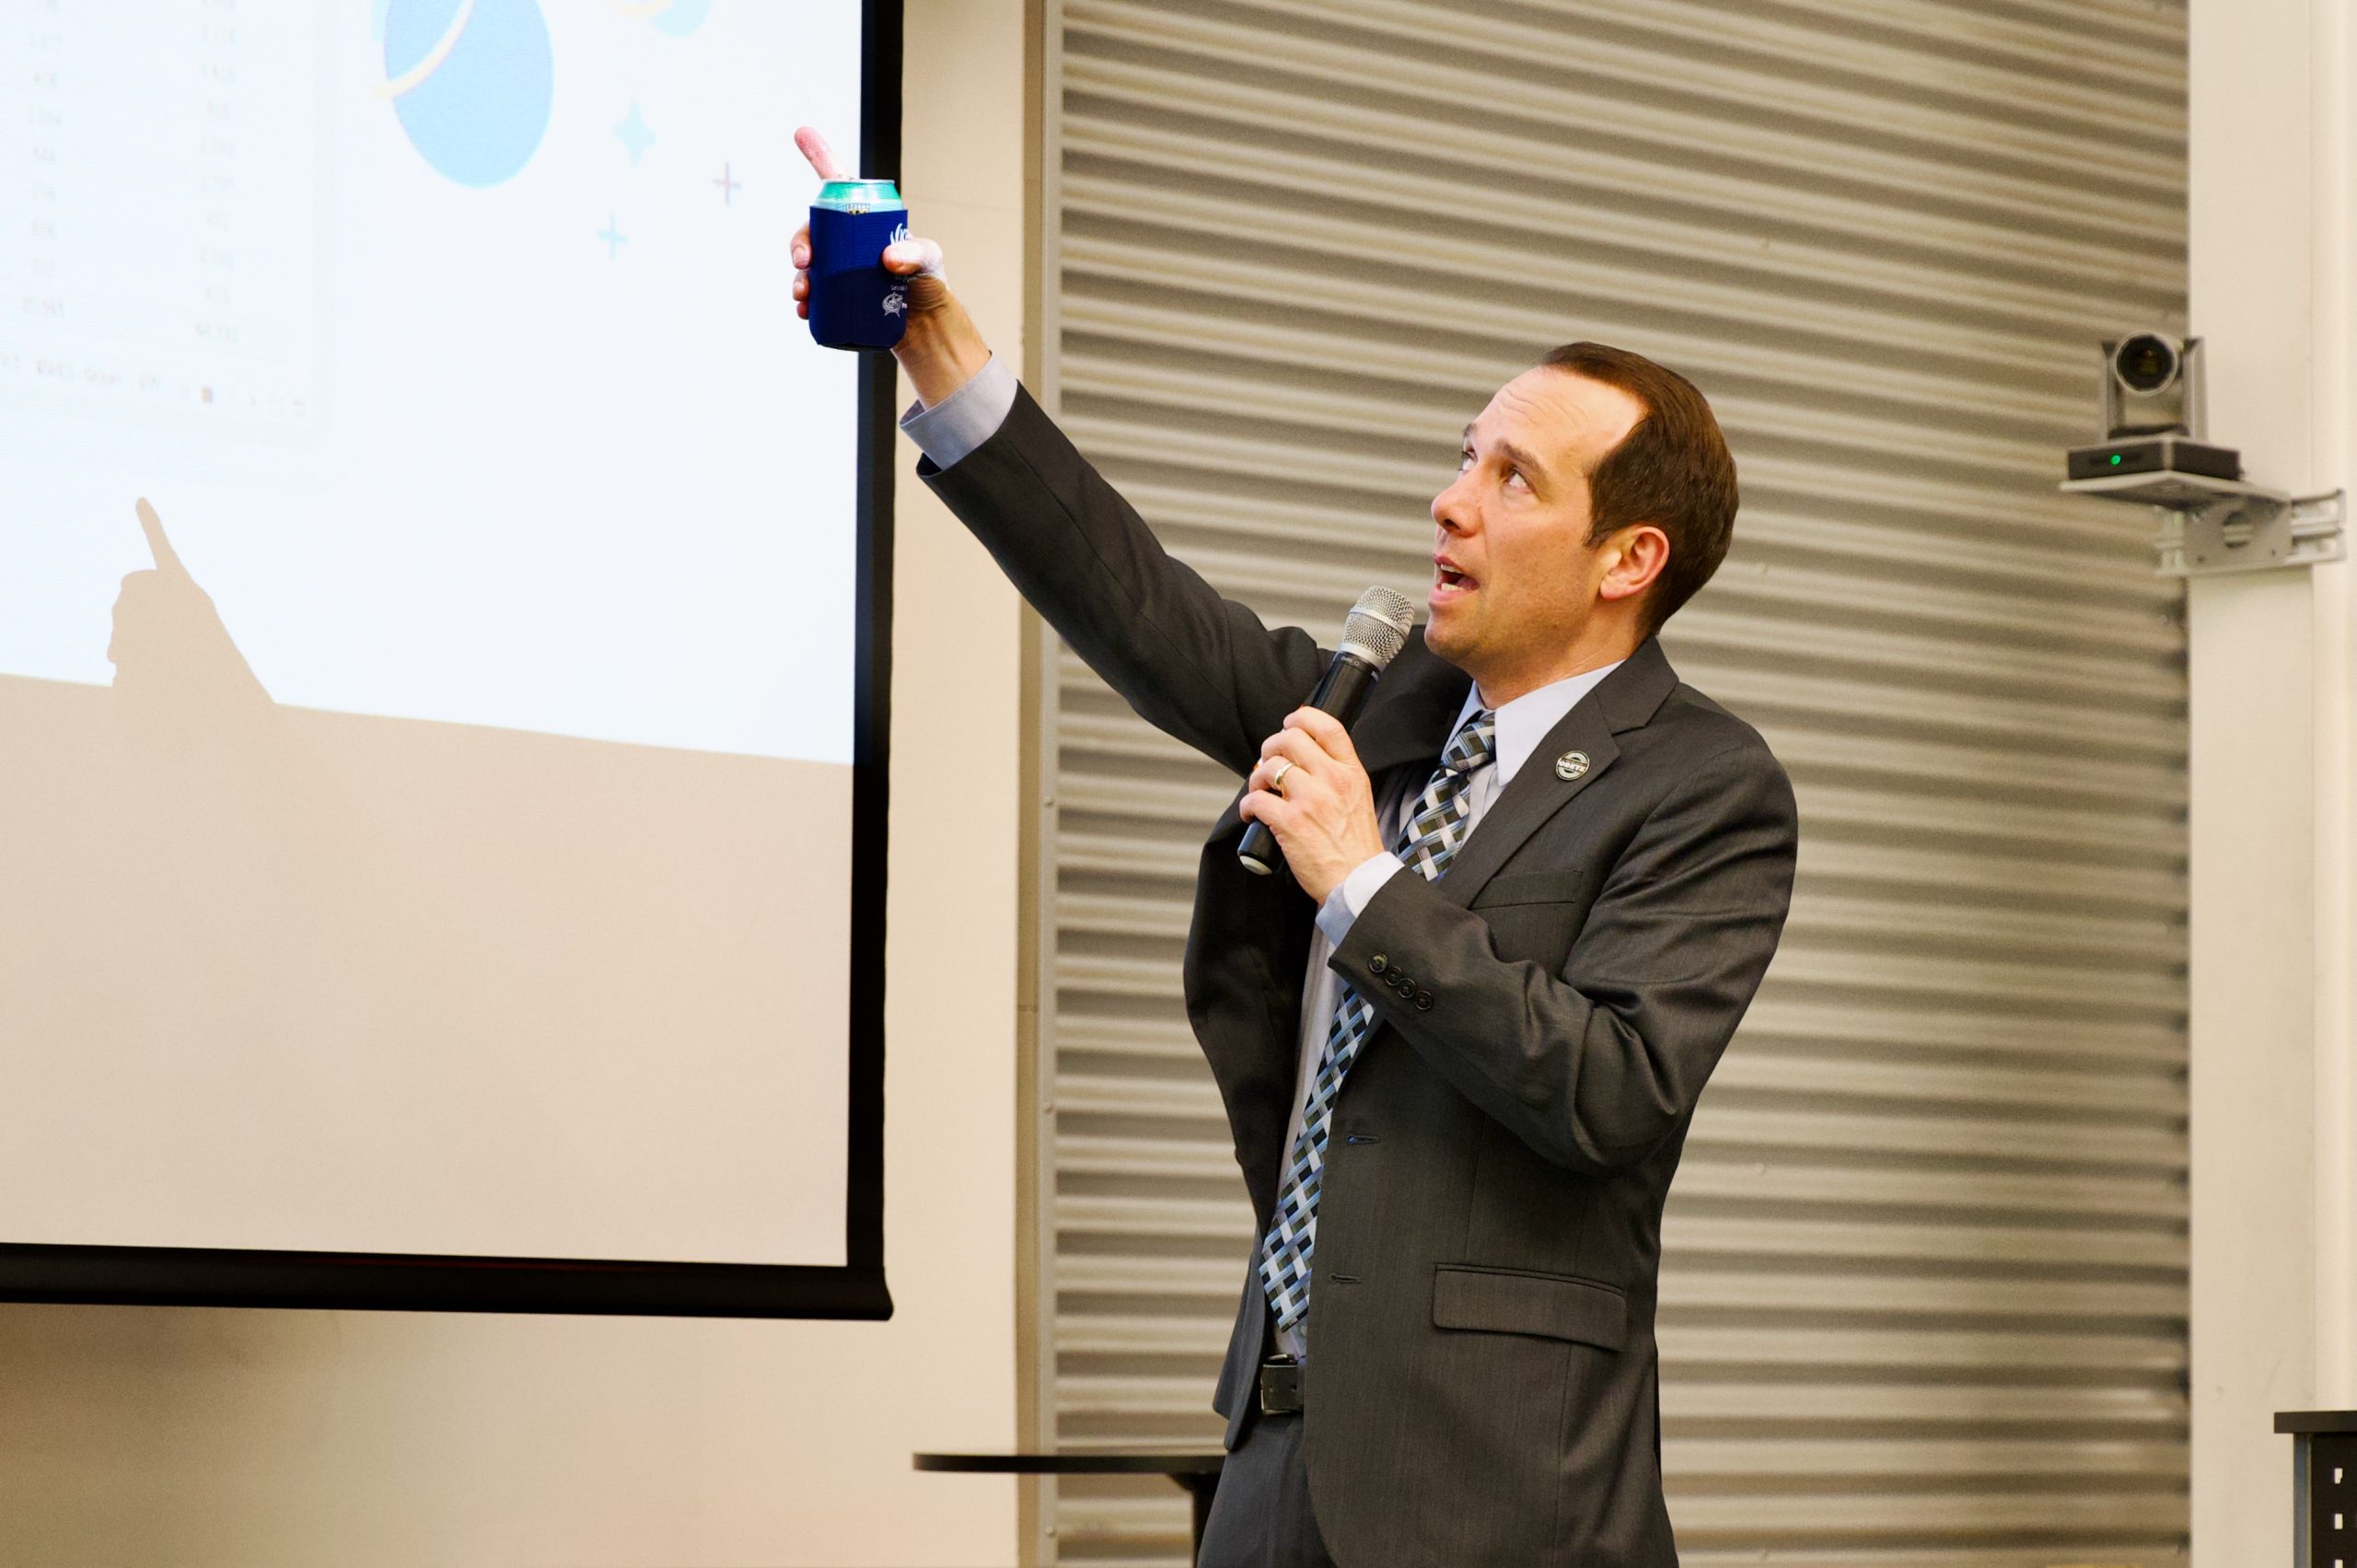
Side note: because the word “curiosity” appeared in the topic title, and because we are big fans of free association here at Columbus Data and Analytics Wednesday, and because generative AI just keeps getting better and better at images and videos, there was an abundance of feline-oriented social media imagery employed for the promotion of this event. We would like to thank Elaine for rolling with it, incorporating one cat image into her presentation, and generally being amused by how that played out.
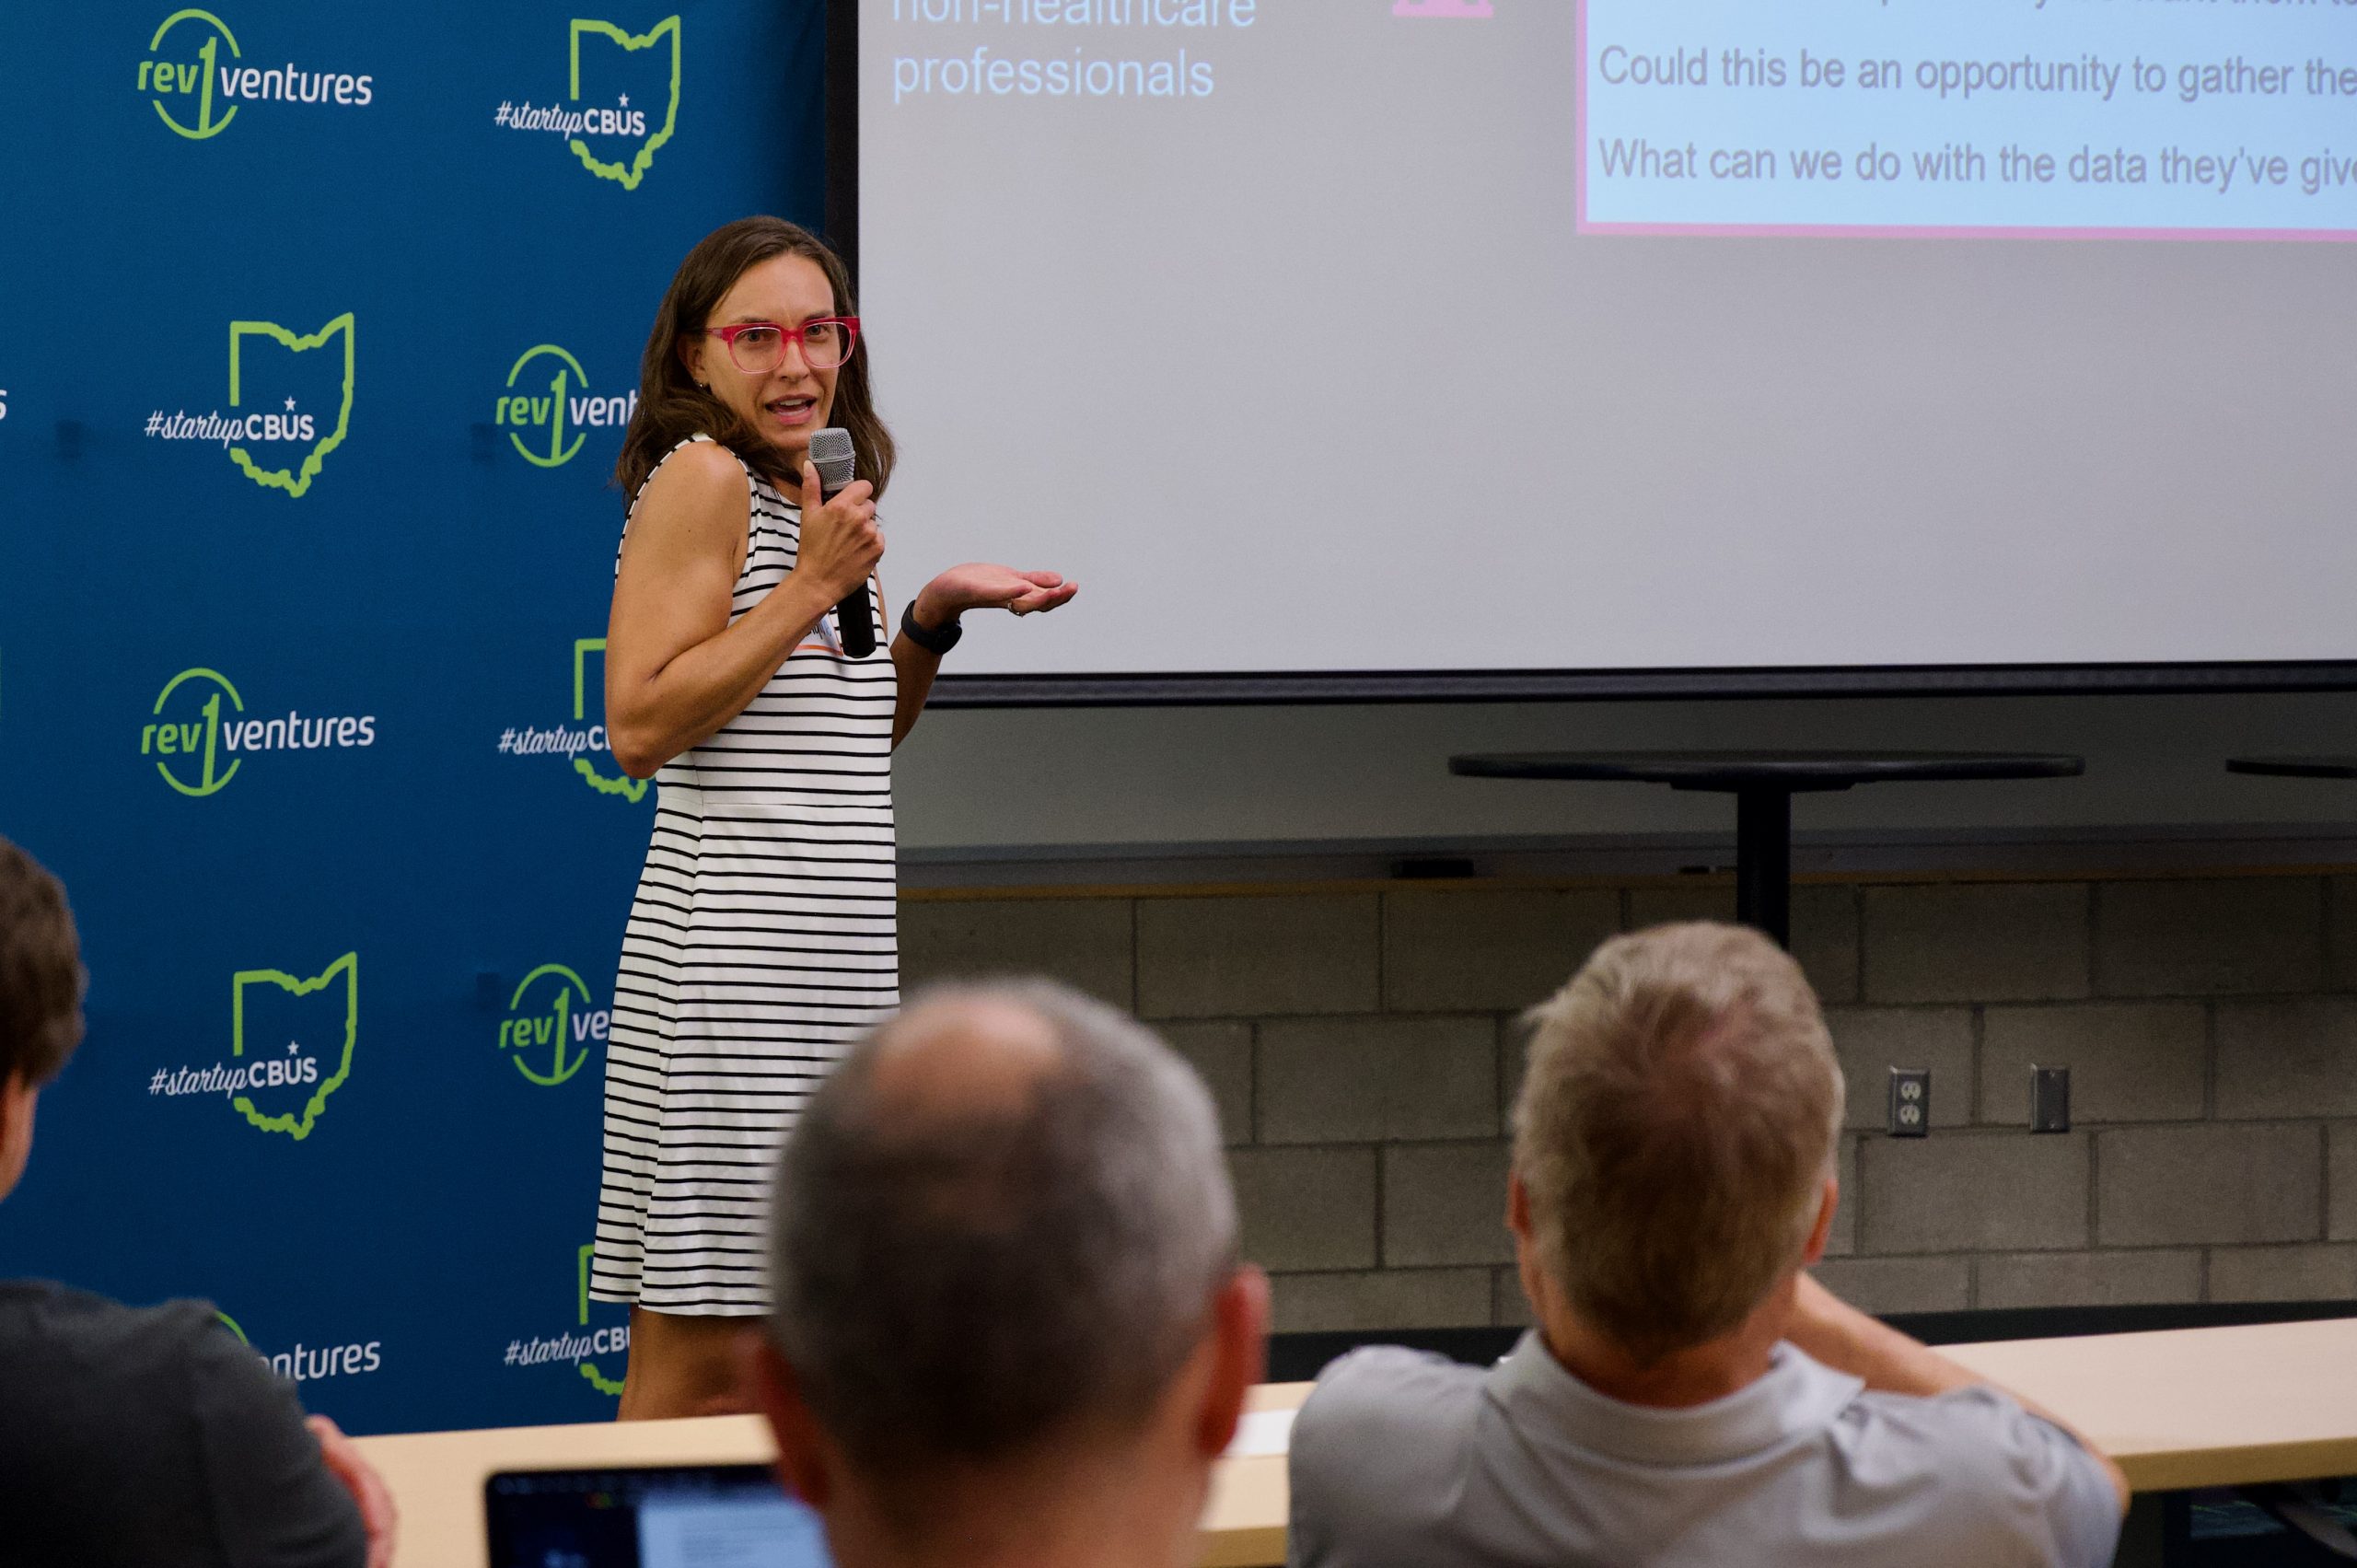
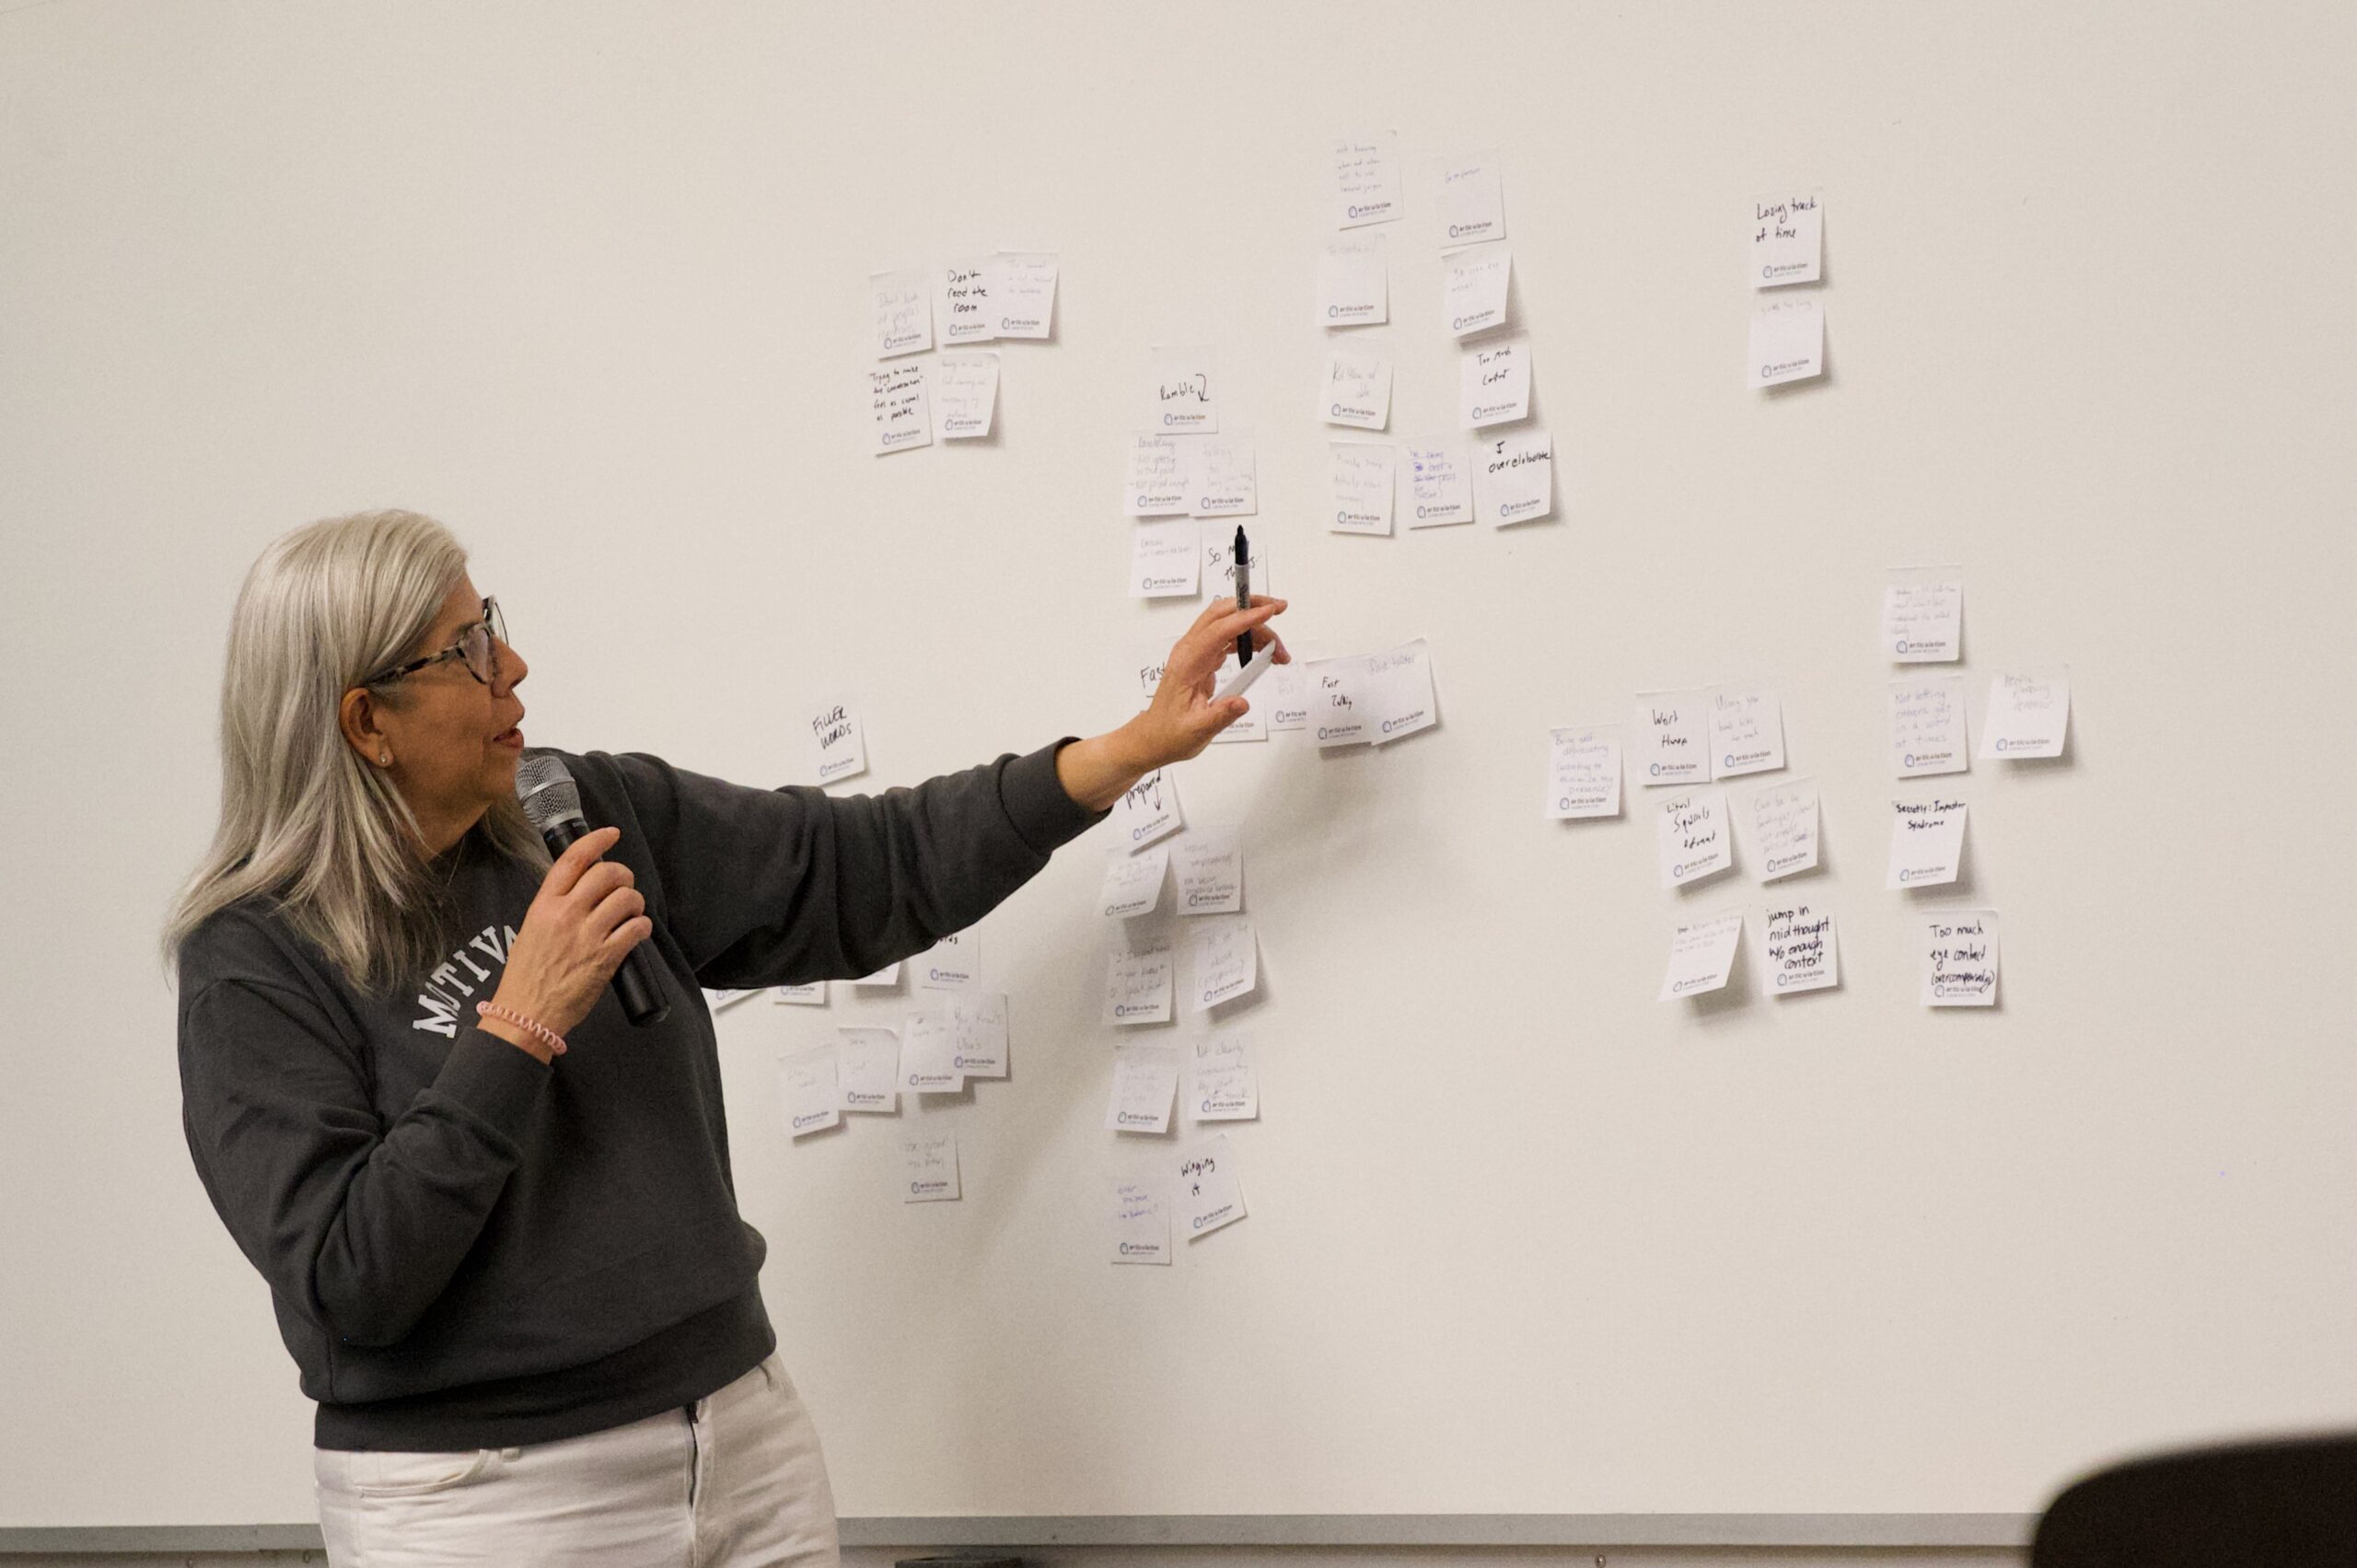
The curiosity Elaine demonstrated comes with discipline, but it’s grounded in an “always be questioning” mindset. In one case, she outlined all the questions that popped into her mind:
- “Where are we missing the mark?”
- “What other content do we have that might be interesting?”
- “What might we need to create?”
- “Do we have any data that could inform what they want?”
- “Should we ask them what they want?”
Importantly, Elaine covered that there is a clear distinction between identifying questions (she keeps a running list of hers in OneNote) and deciding which ones are worth pursuing answers to. The latter comes from thinking through both the extent to which an answer would inform a decision or a change to the user experience, as well as the cost/effort to come up with an answer.
And, she keeps a more disciplined log of experimentation ideas that is more broadly shared and includes ideas from others in the organization.
Through a range of examples, Elaine demonstrated that the sources, motivations, and tradeoffs of questions are real:
- Is the curiosity about a metric that can be easily manipulated that doesn’t reflect actual value to the business (want to improve your email click rate? Scrub your list! Shrink the denominator!)?
- Is the curiosity around who the person is and what they care about (you might need to, well, ask them!)?
- Is the curiosity trying to thread a needle of competing interests (donation revenue vs. email signups)? Can that needle be threaded successfully? (Answer: yes, often!)
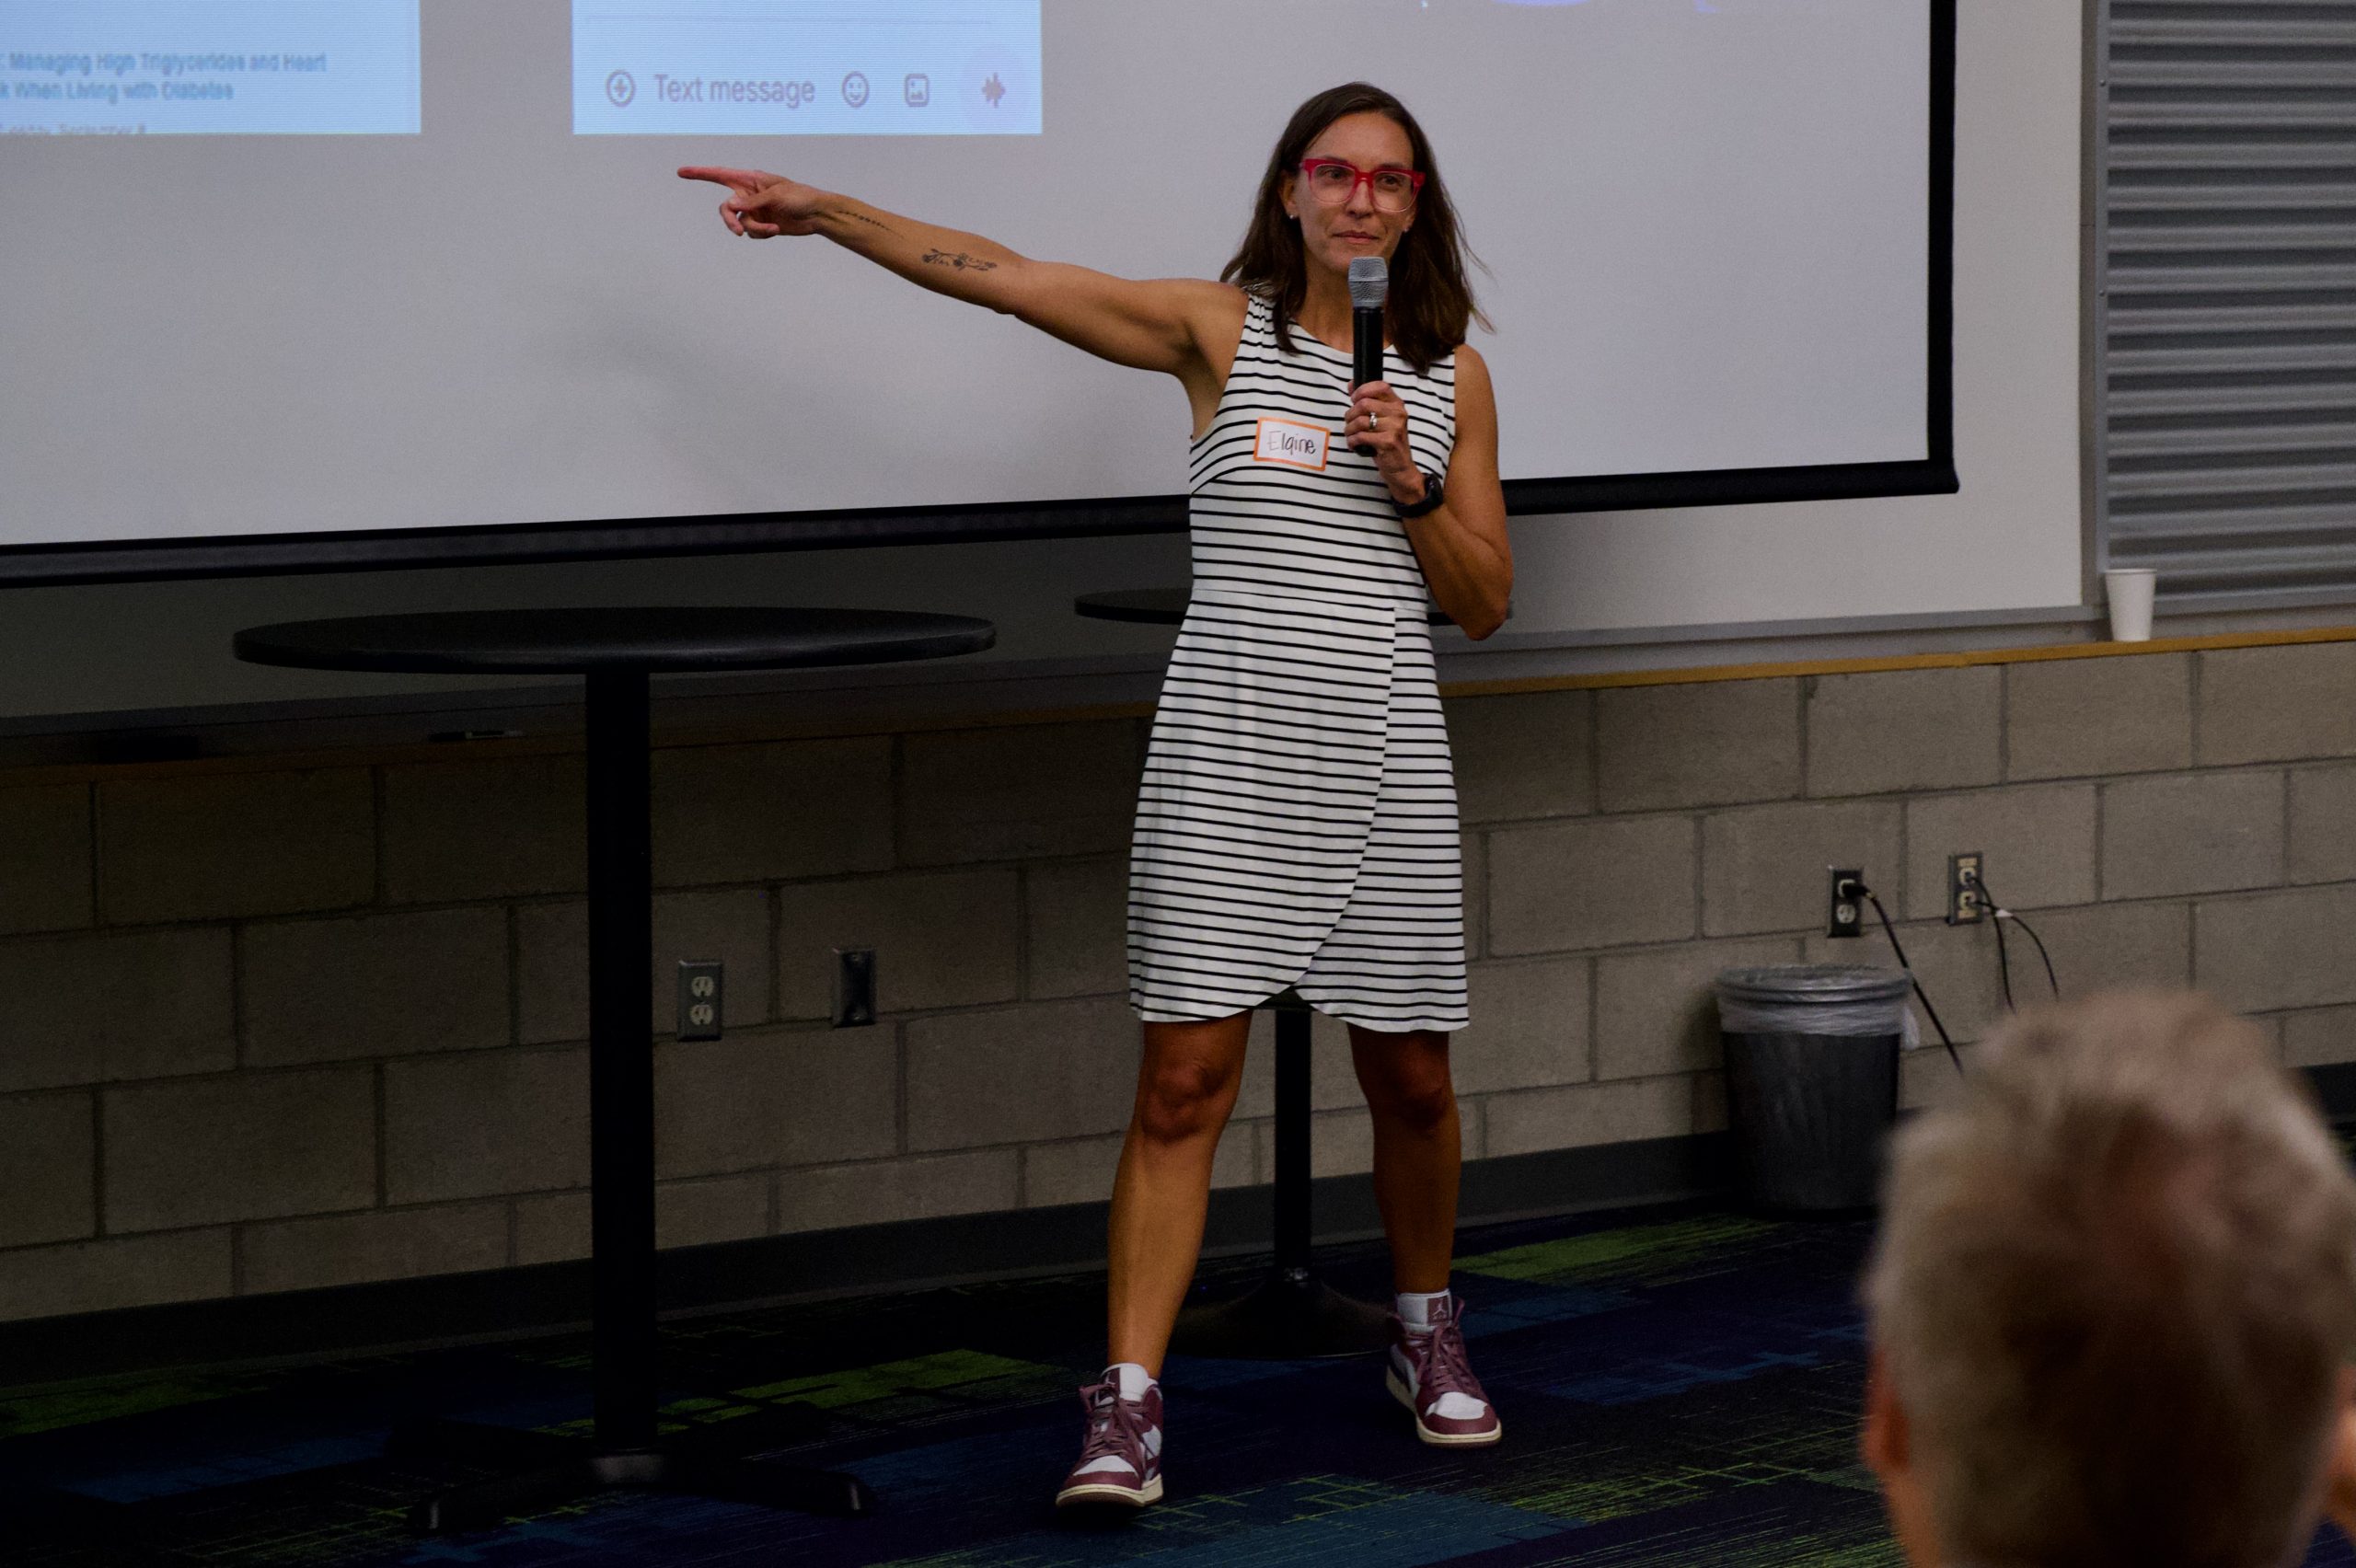
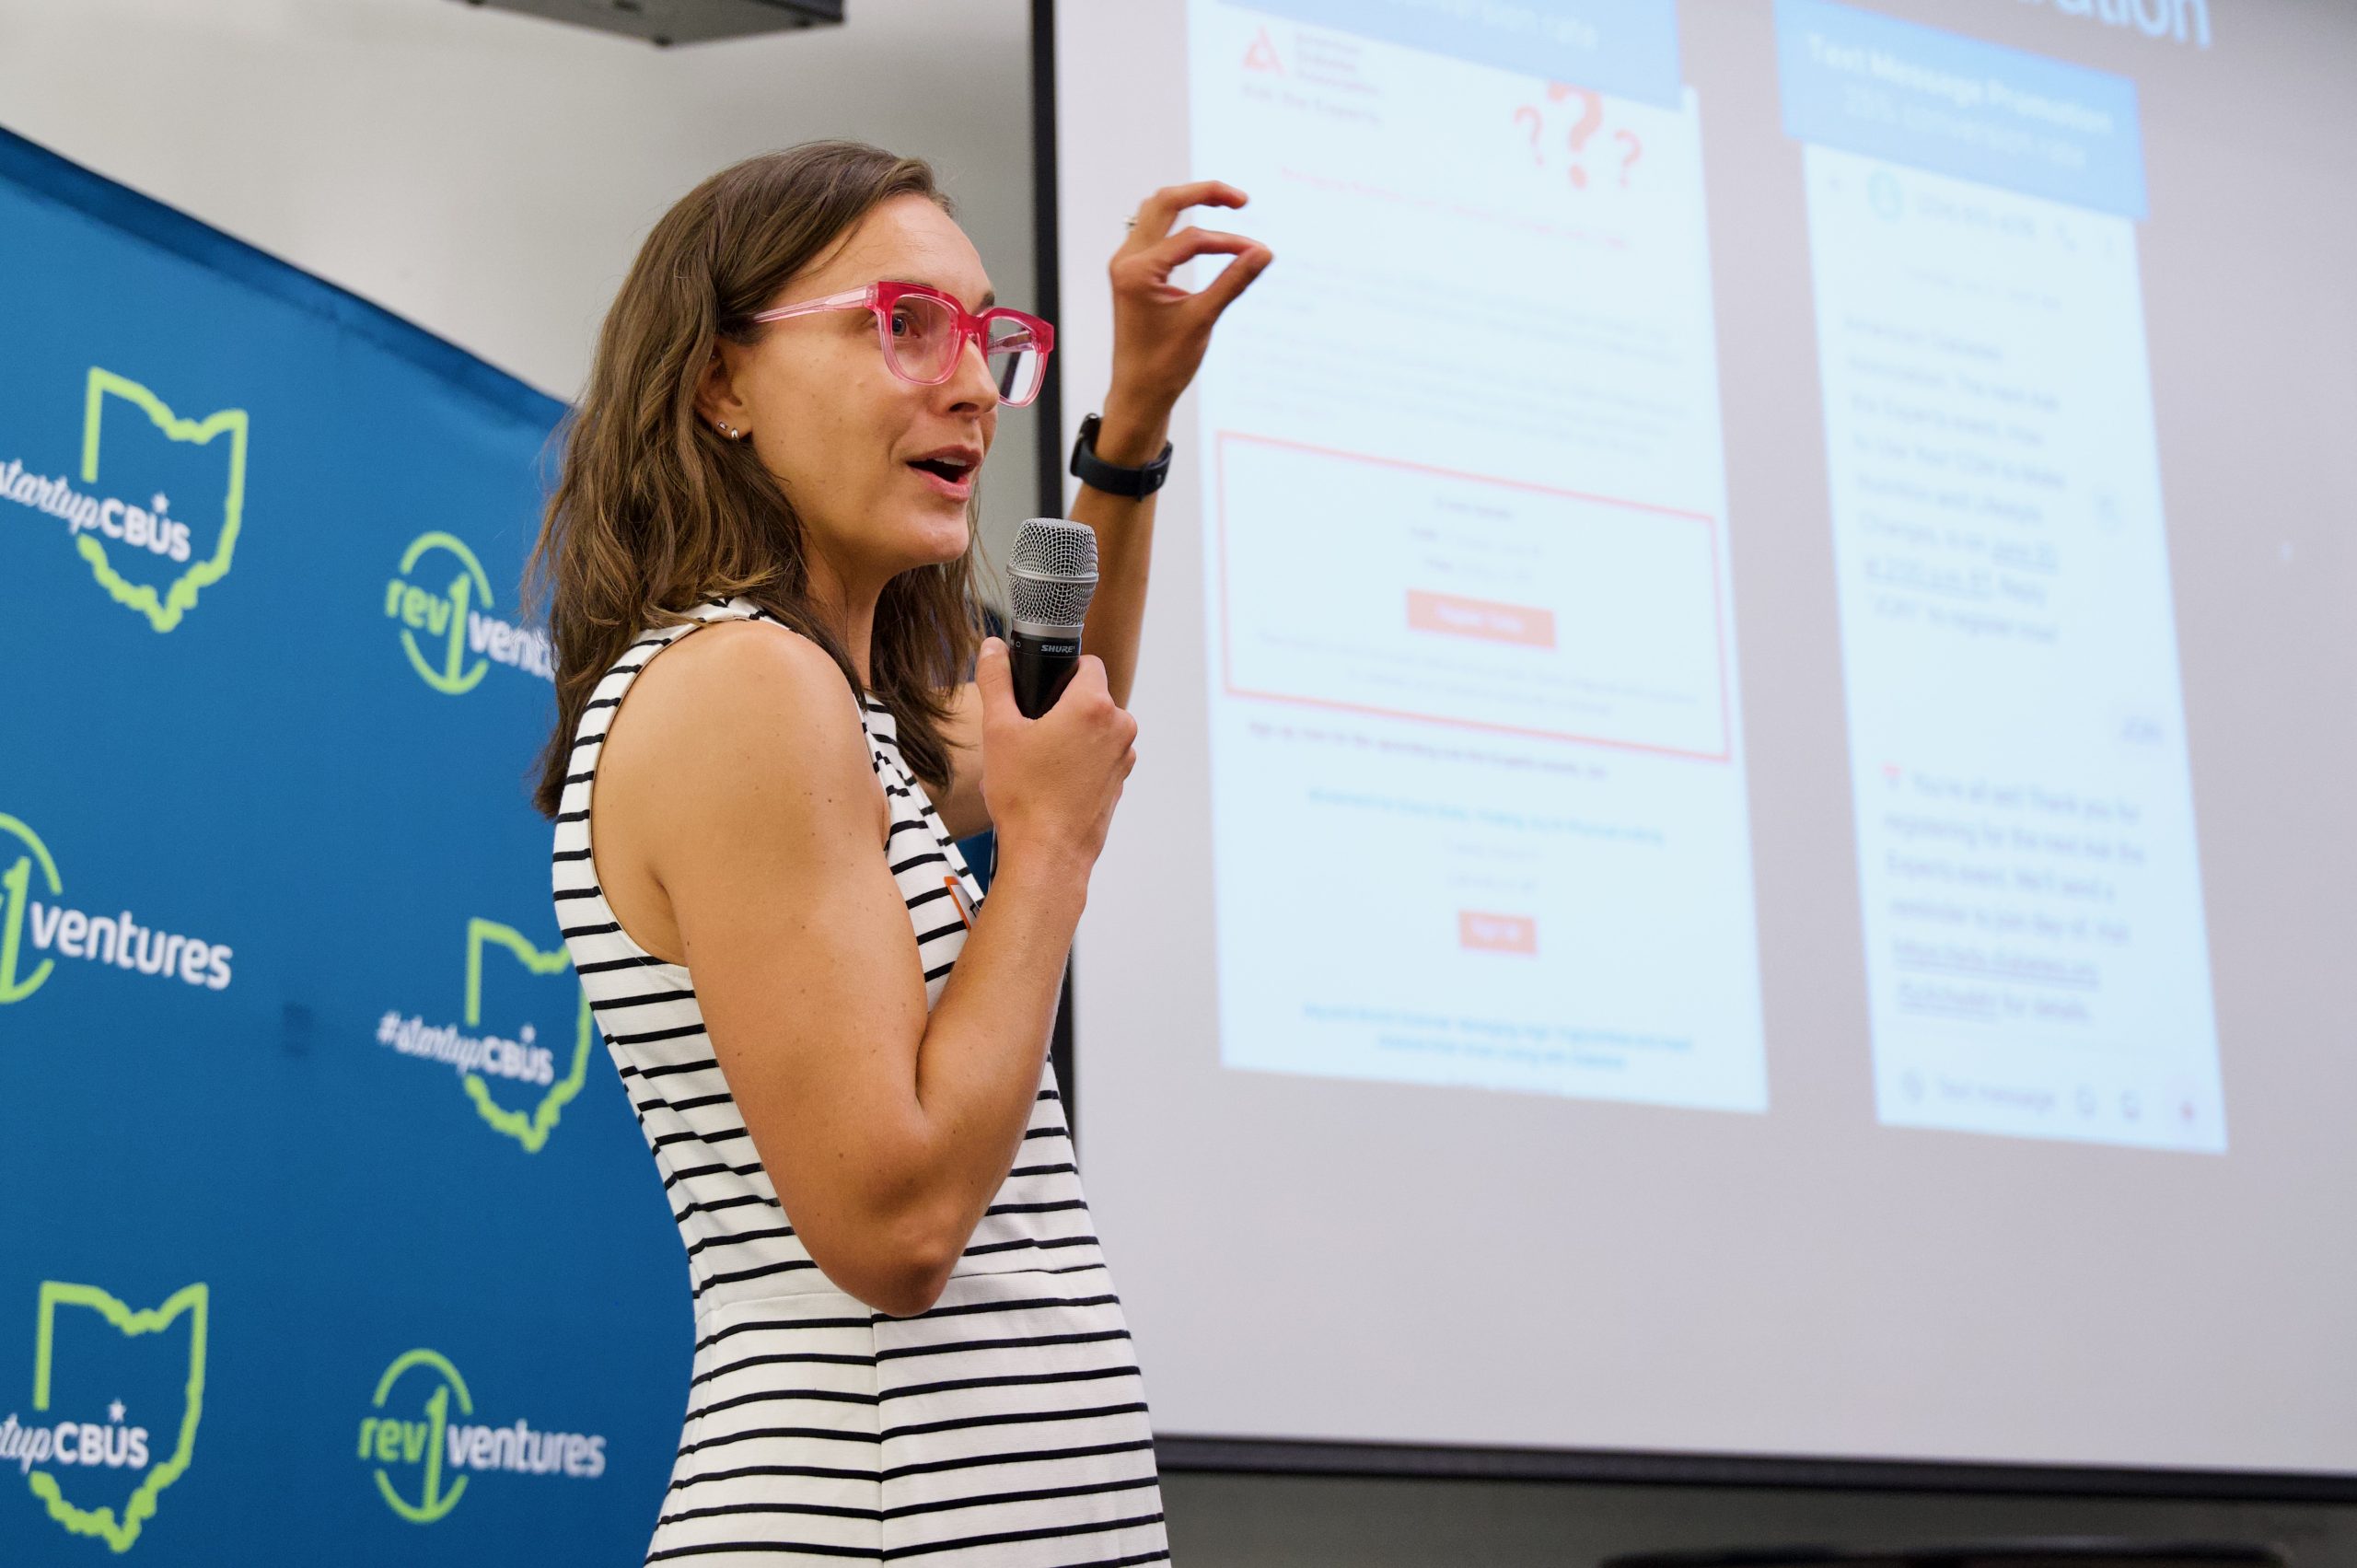
- Is the curiosity about trying an entirely new tactic, such as a streamlined process for registering for an event when using SMS (“Reply with ‘JOIN'” and you’re registered!) rather than simply replicating the email/web process (“Fill out this registration form…from your phone.”)
- Is the curiosity a passive-aggressive experiment—not one that you want to go to all that often, but, sometimes, you just have to prove a ding-dong wrong (amiright‽)?
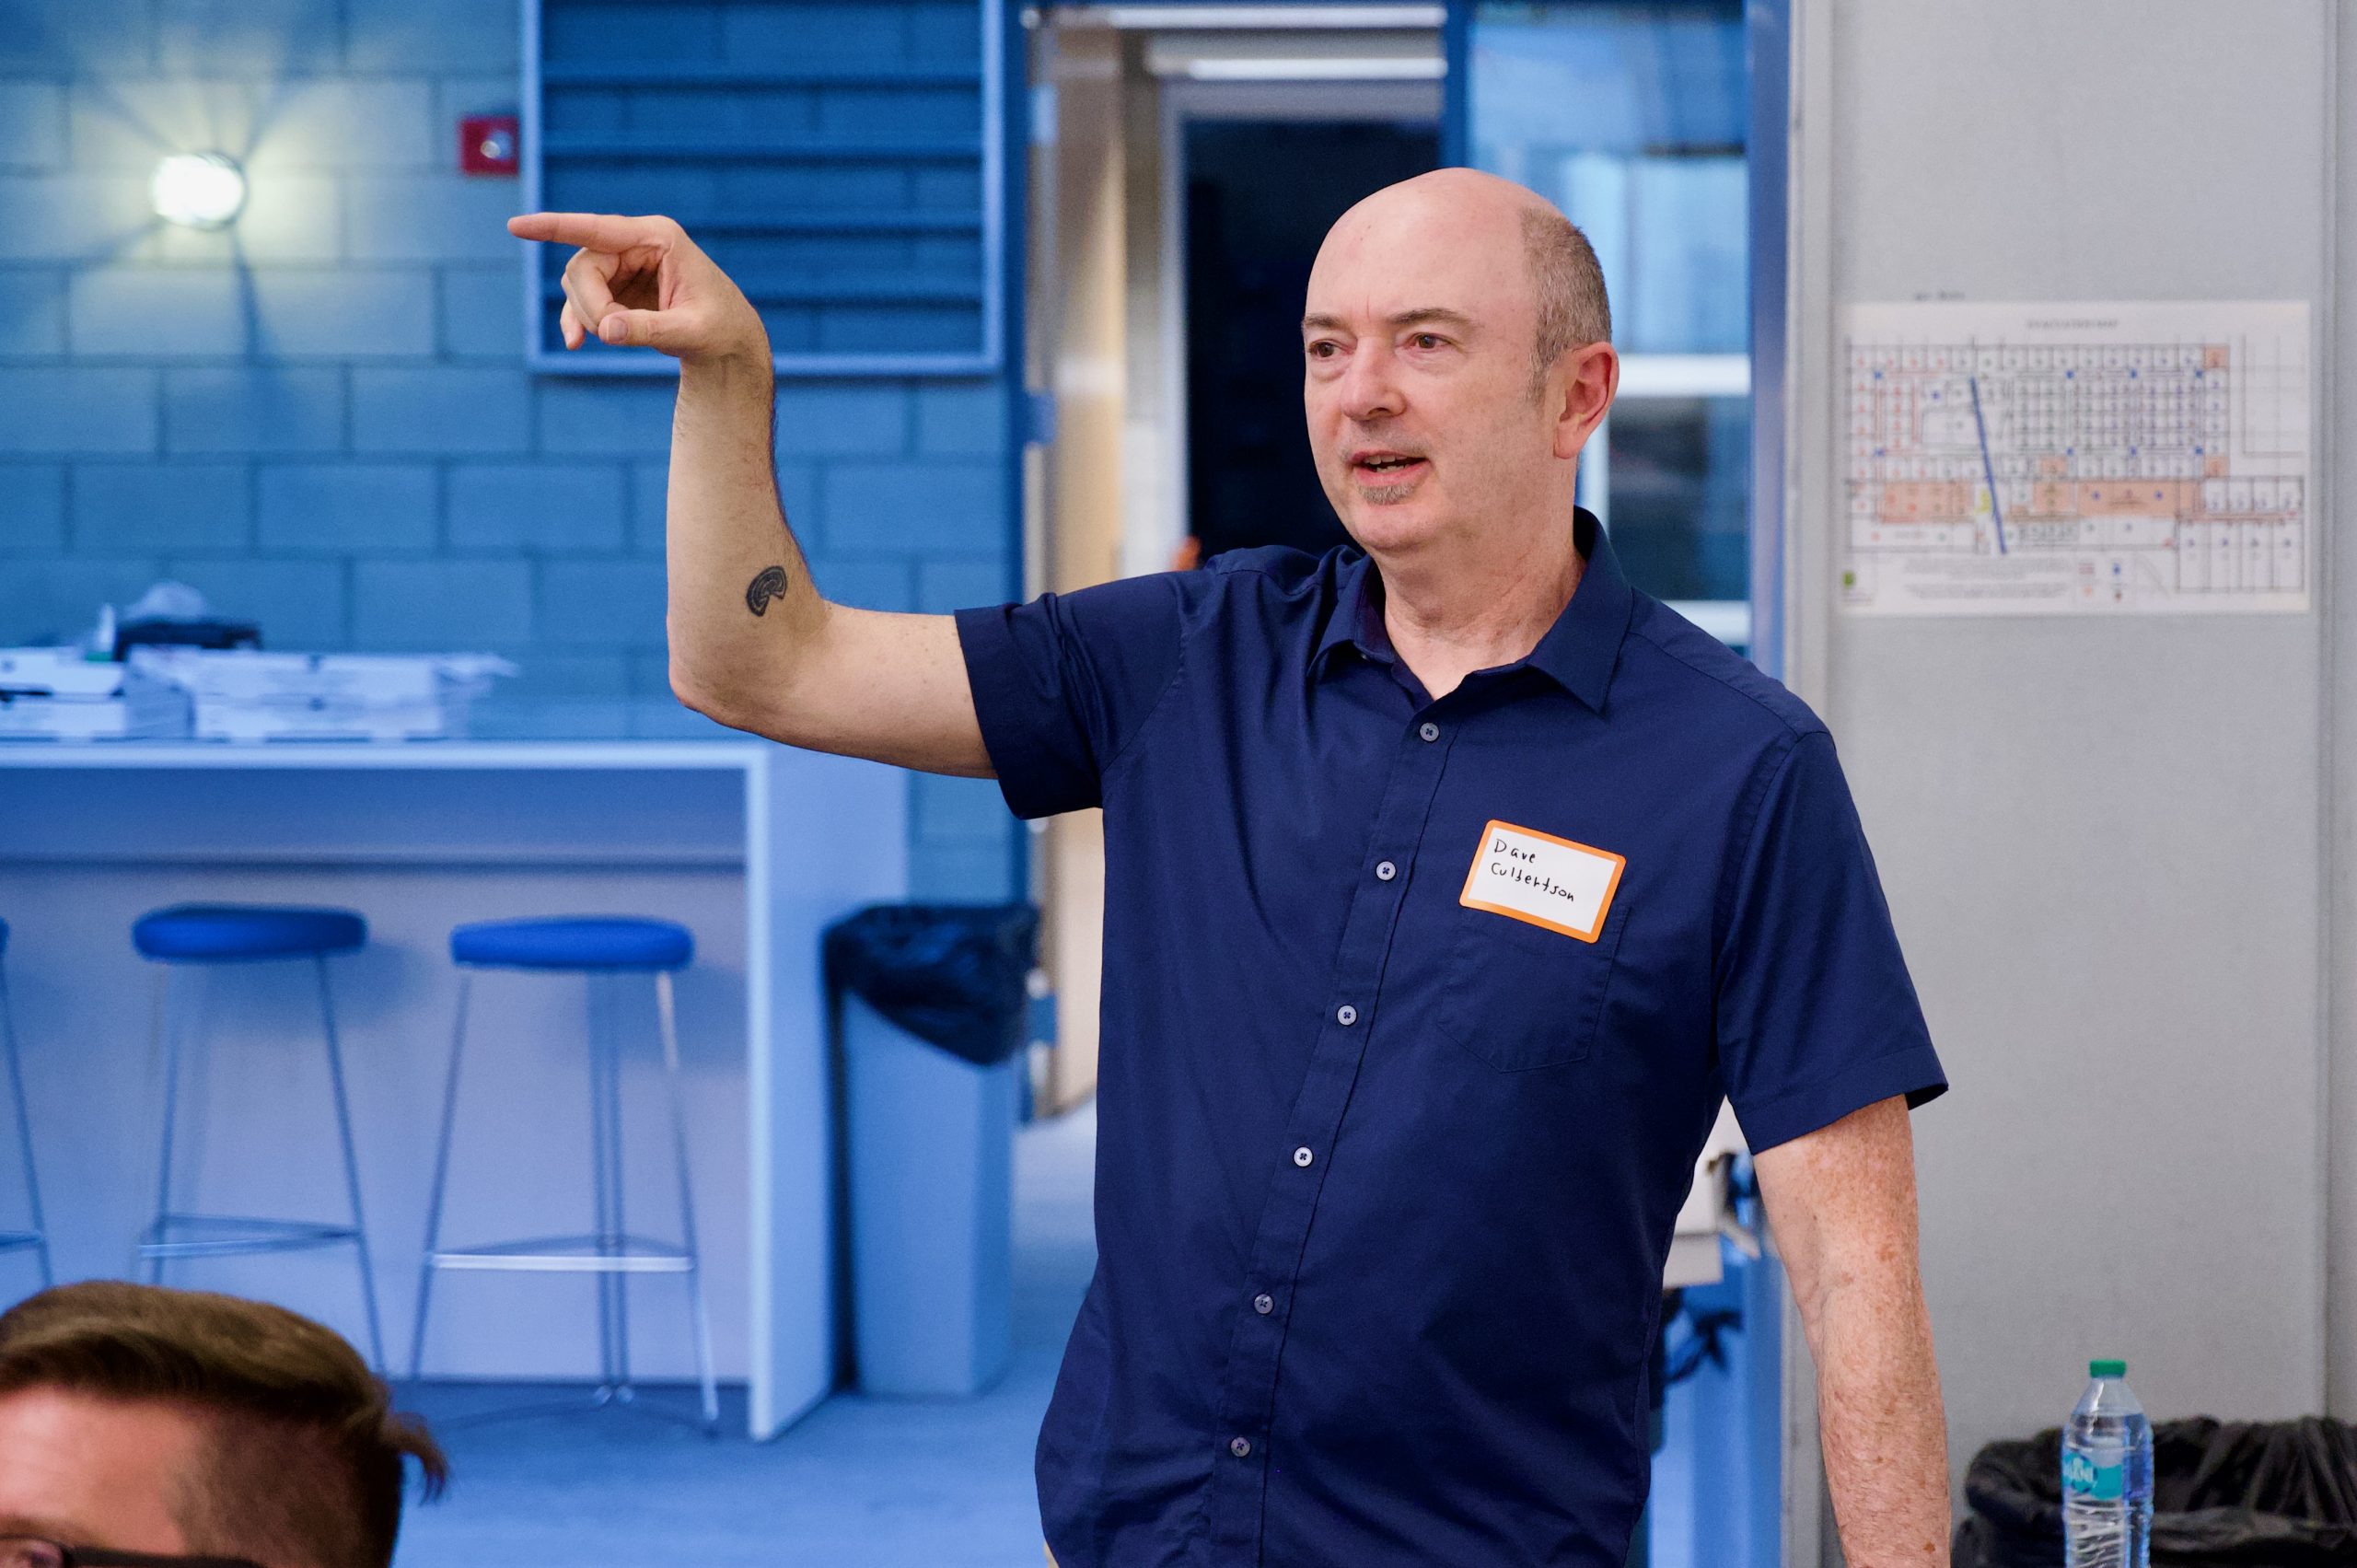
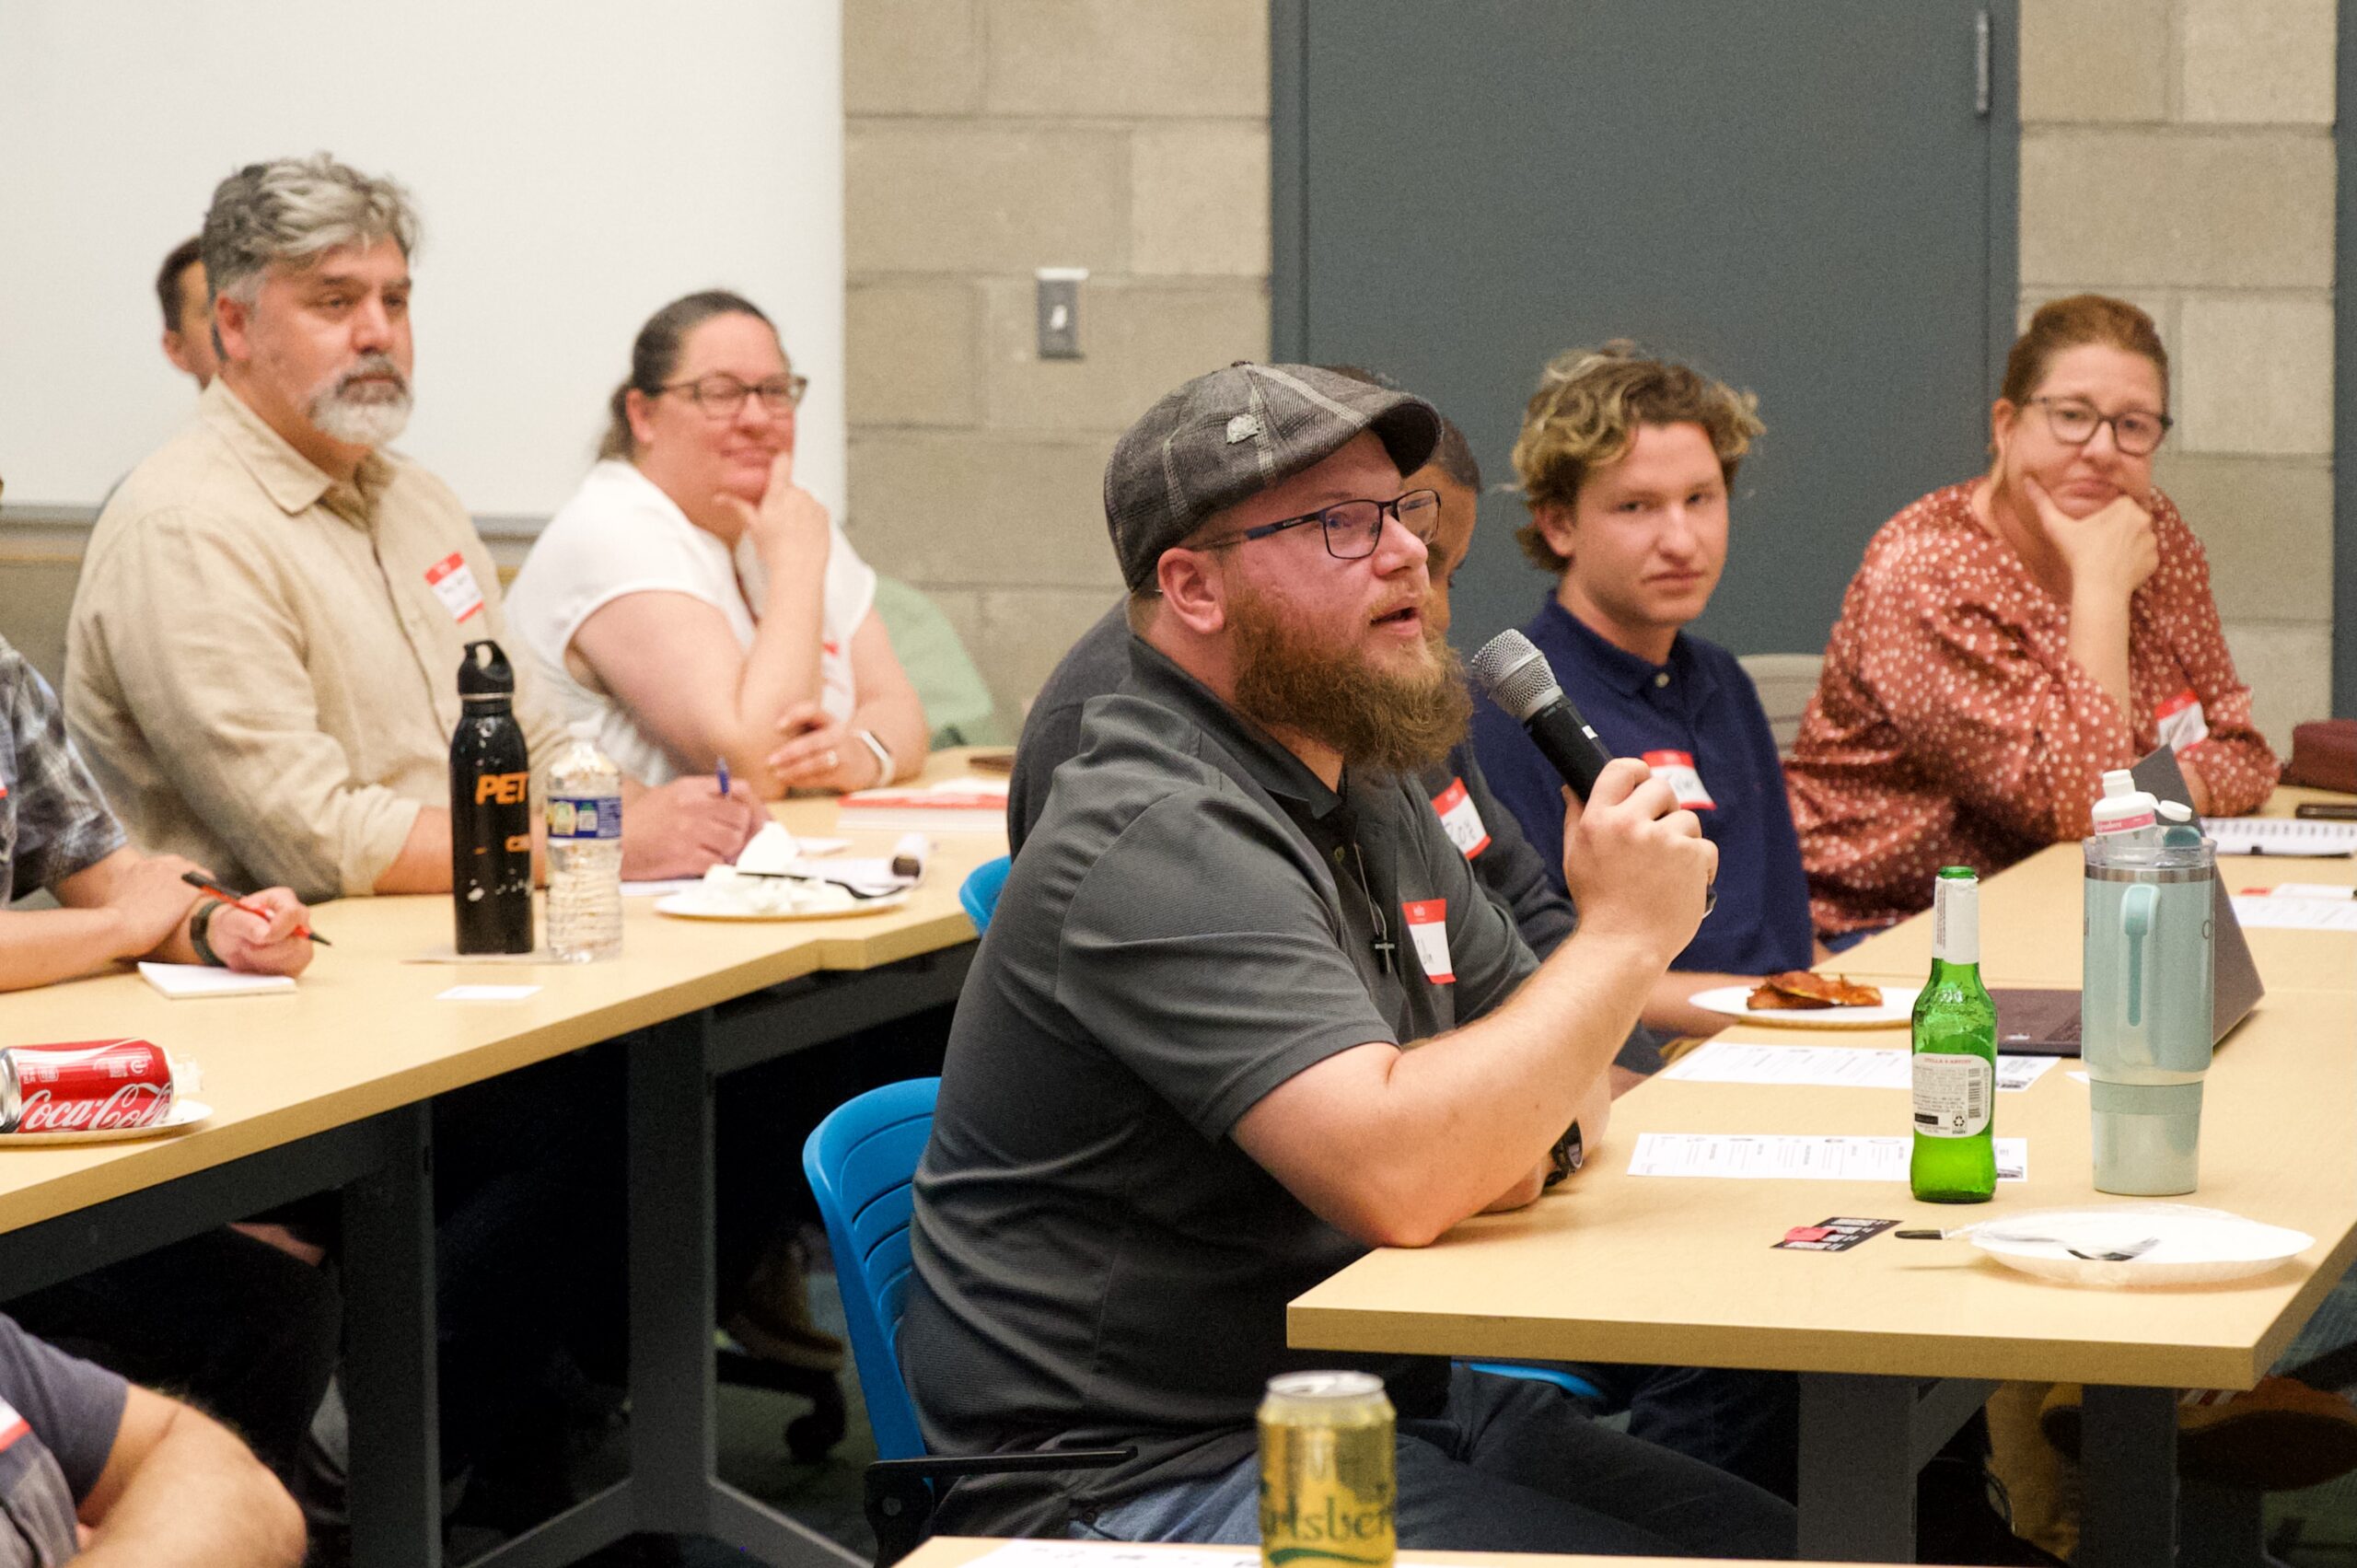
There was a level of dismay among many of the attendees when Elaine shared that she does not (yet) have direct access to the organization’s digital analytics platform. This led to a discussion of bounce rate that at least one attendee (possibly the one writing this recap) found dismaying, but who are we to judge? (We judge.)
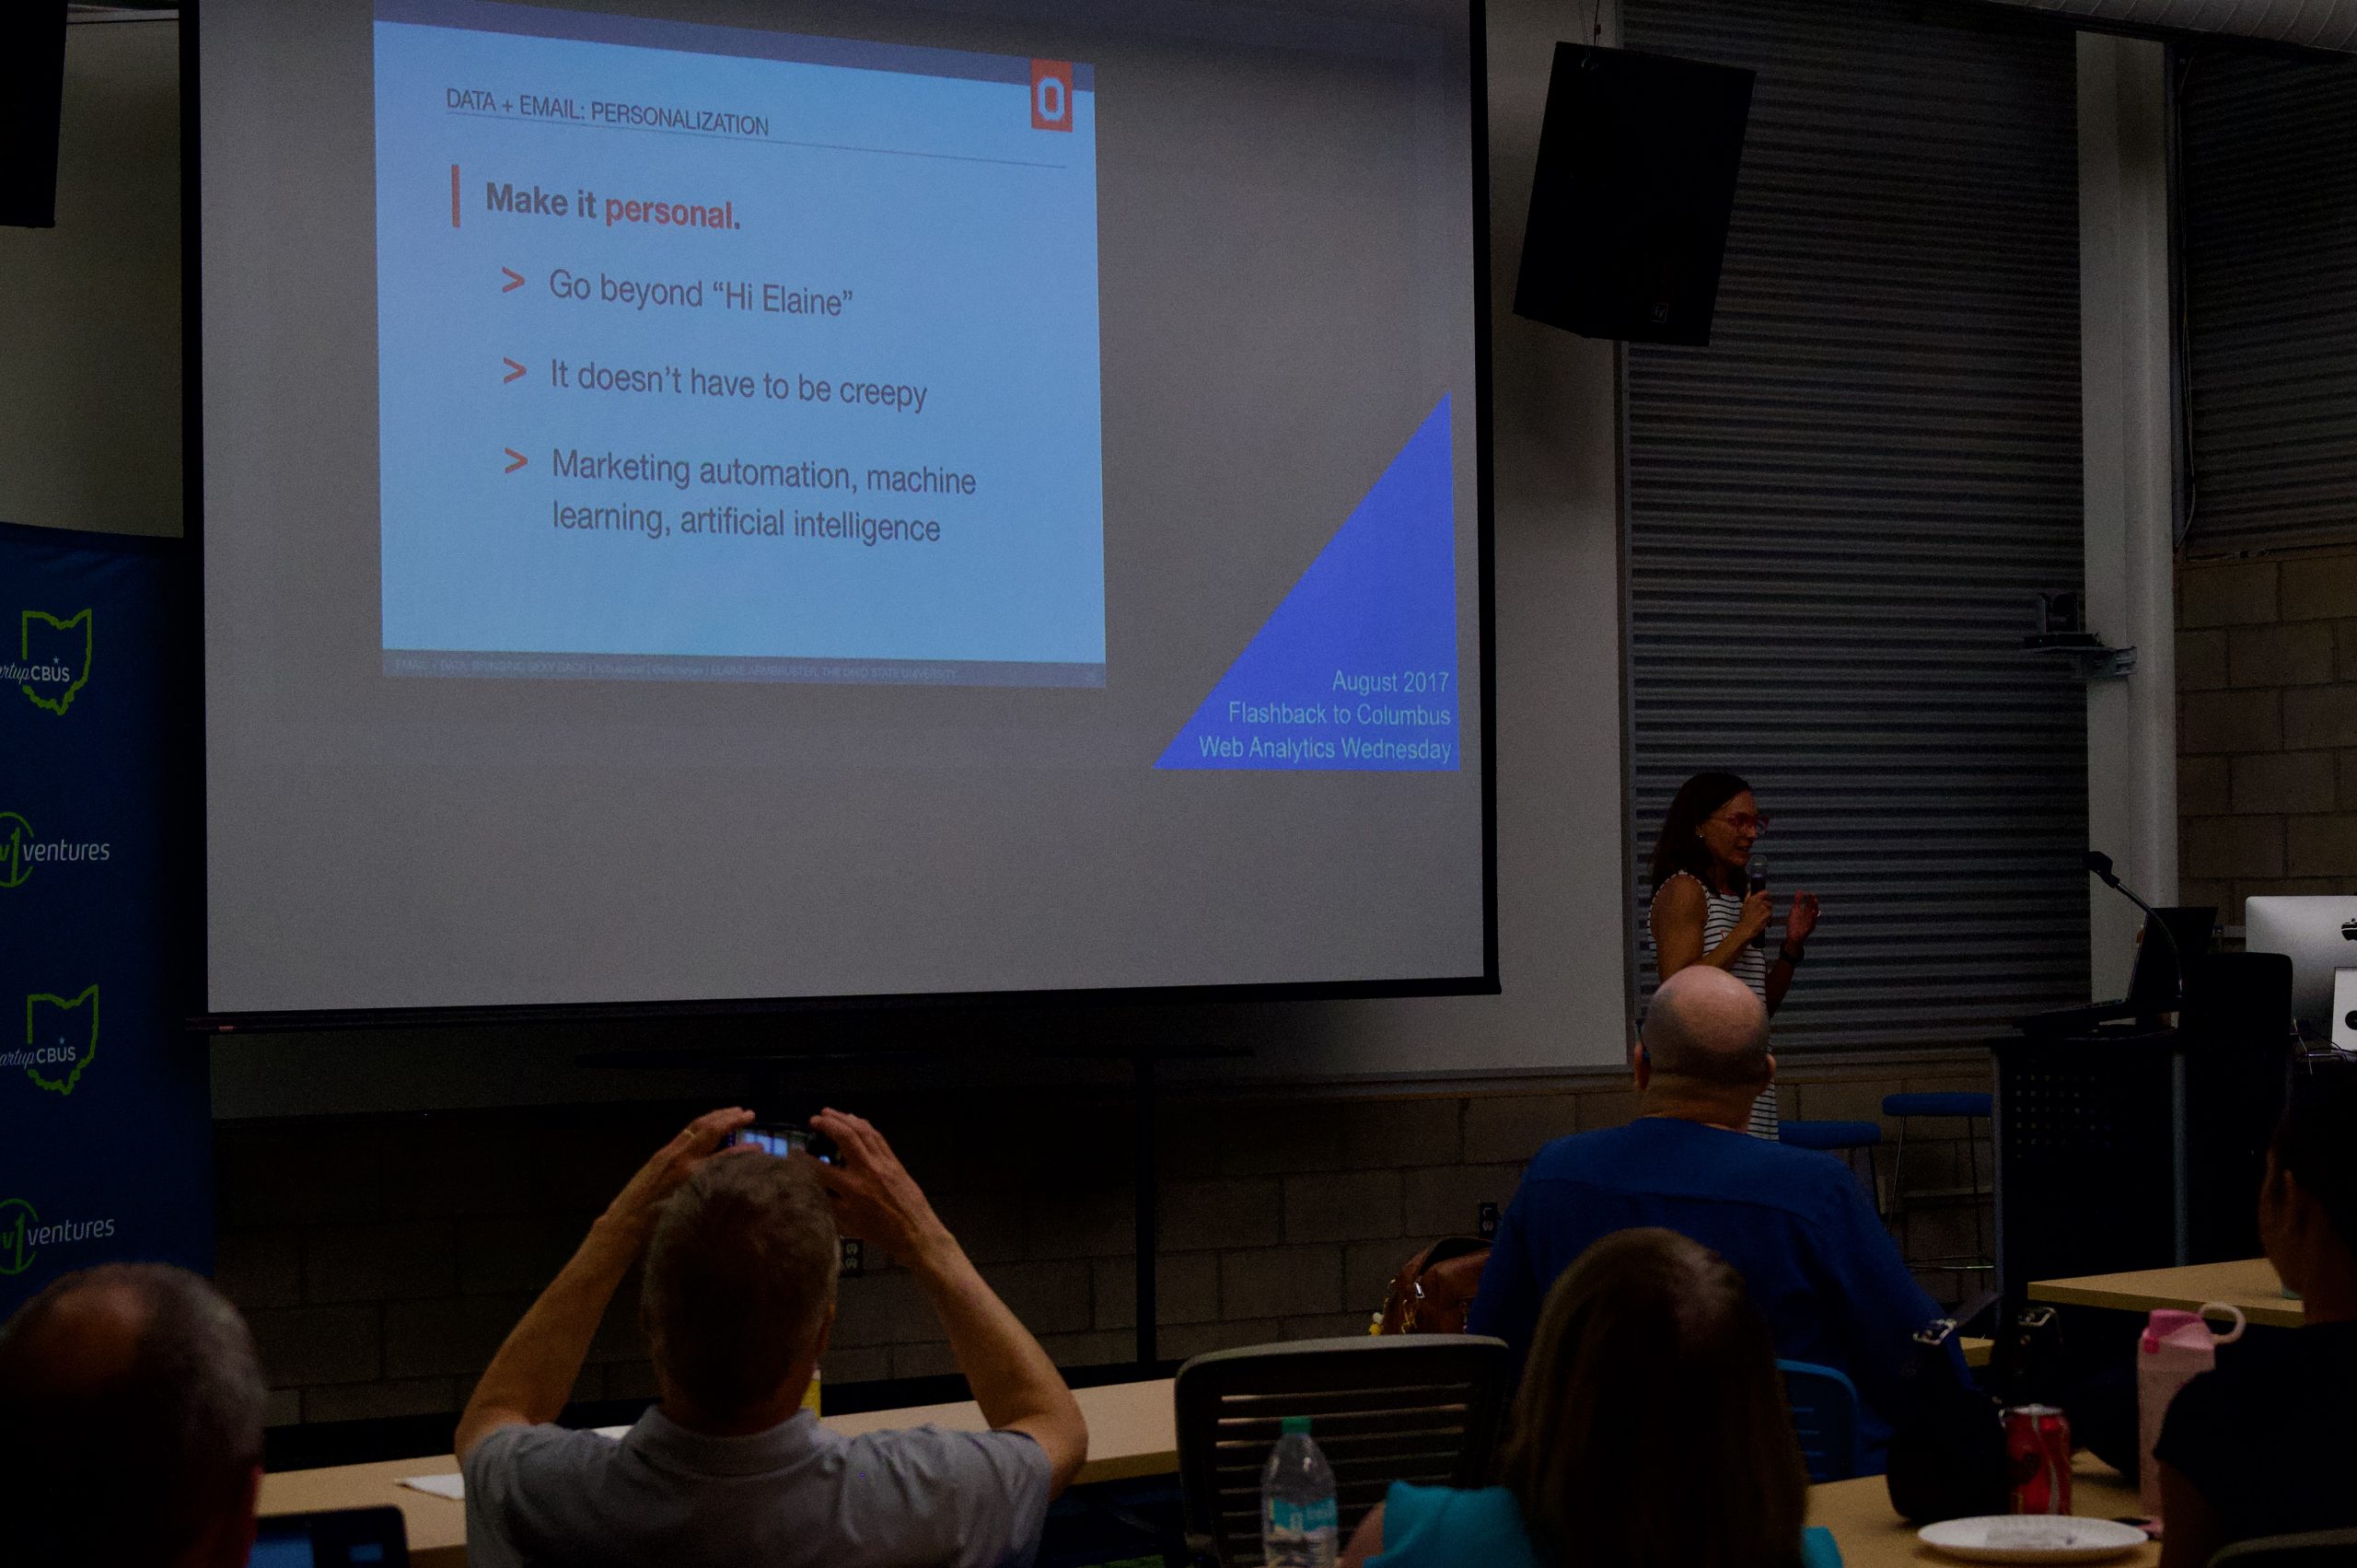
As noted at the beginning of this recap, Elaine spoke at the meetup back in 2017, and she ended her presentation with a couple of callbacks to that appearance:
- She’d called out machine learning and artificial intelligence as mechanisms for making digital experiences truly personalized (going beyond “Hi [First Name],”)
- She realized that she had an in-flight e-newsletter test that she’d been excited about at the time and had told the audience “results coming soon.” Time is all relative, so we’ll say 9 years is soon enough: she dug up and shared the results (the test showed dramatically positive results, and the newsletter went on to be wildly successful…until it got killed; Elaine was not bitter about that at all, and there is no video of this month’s event to prove otherwise).
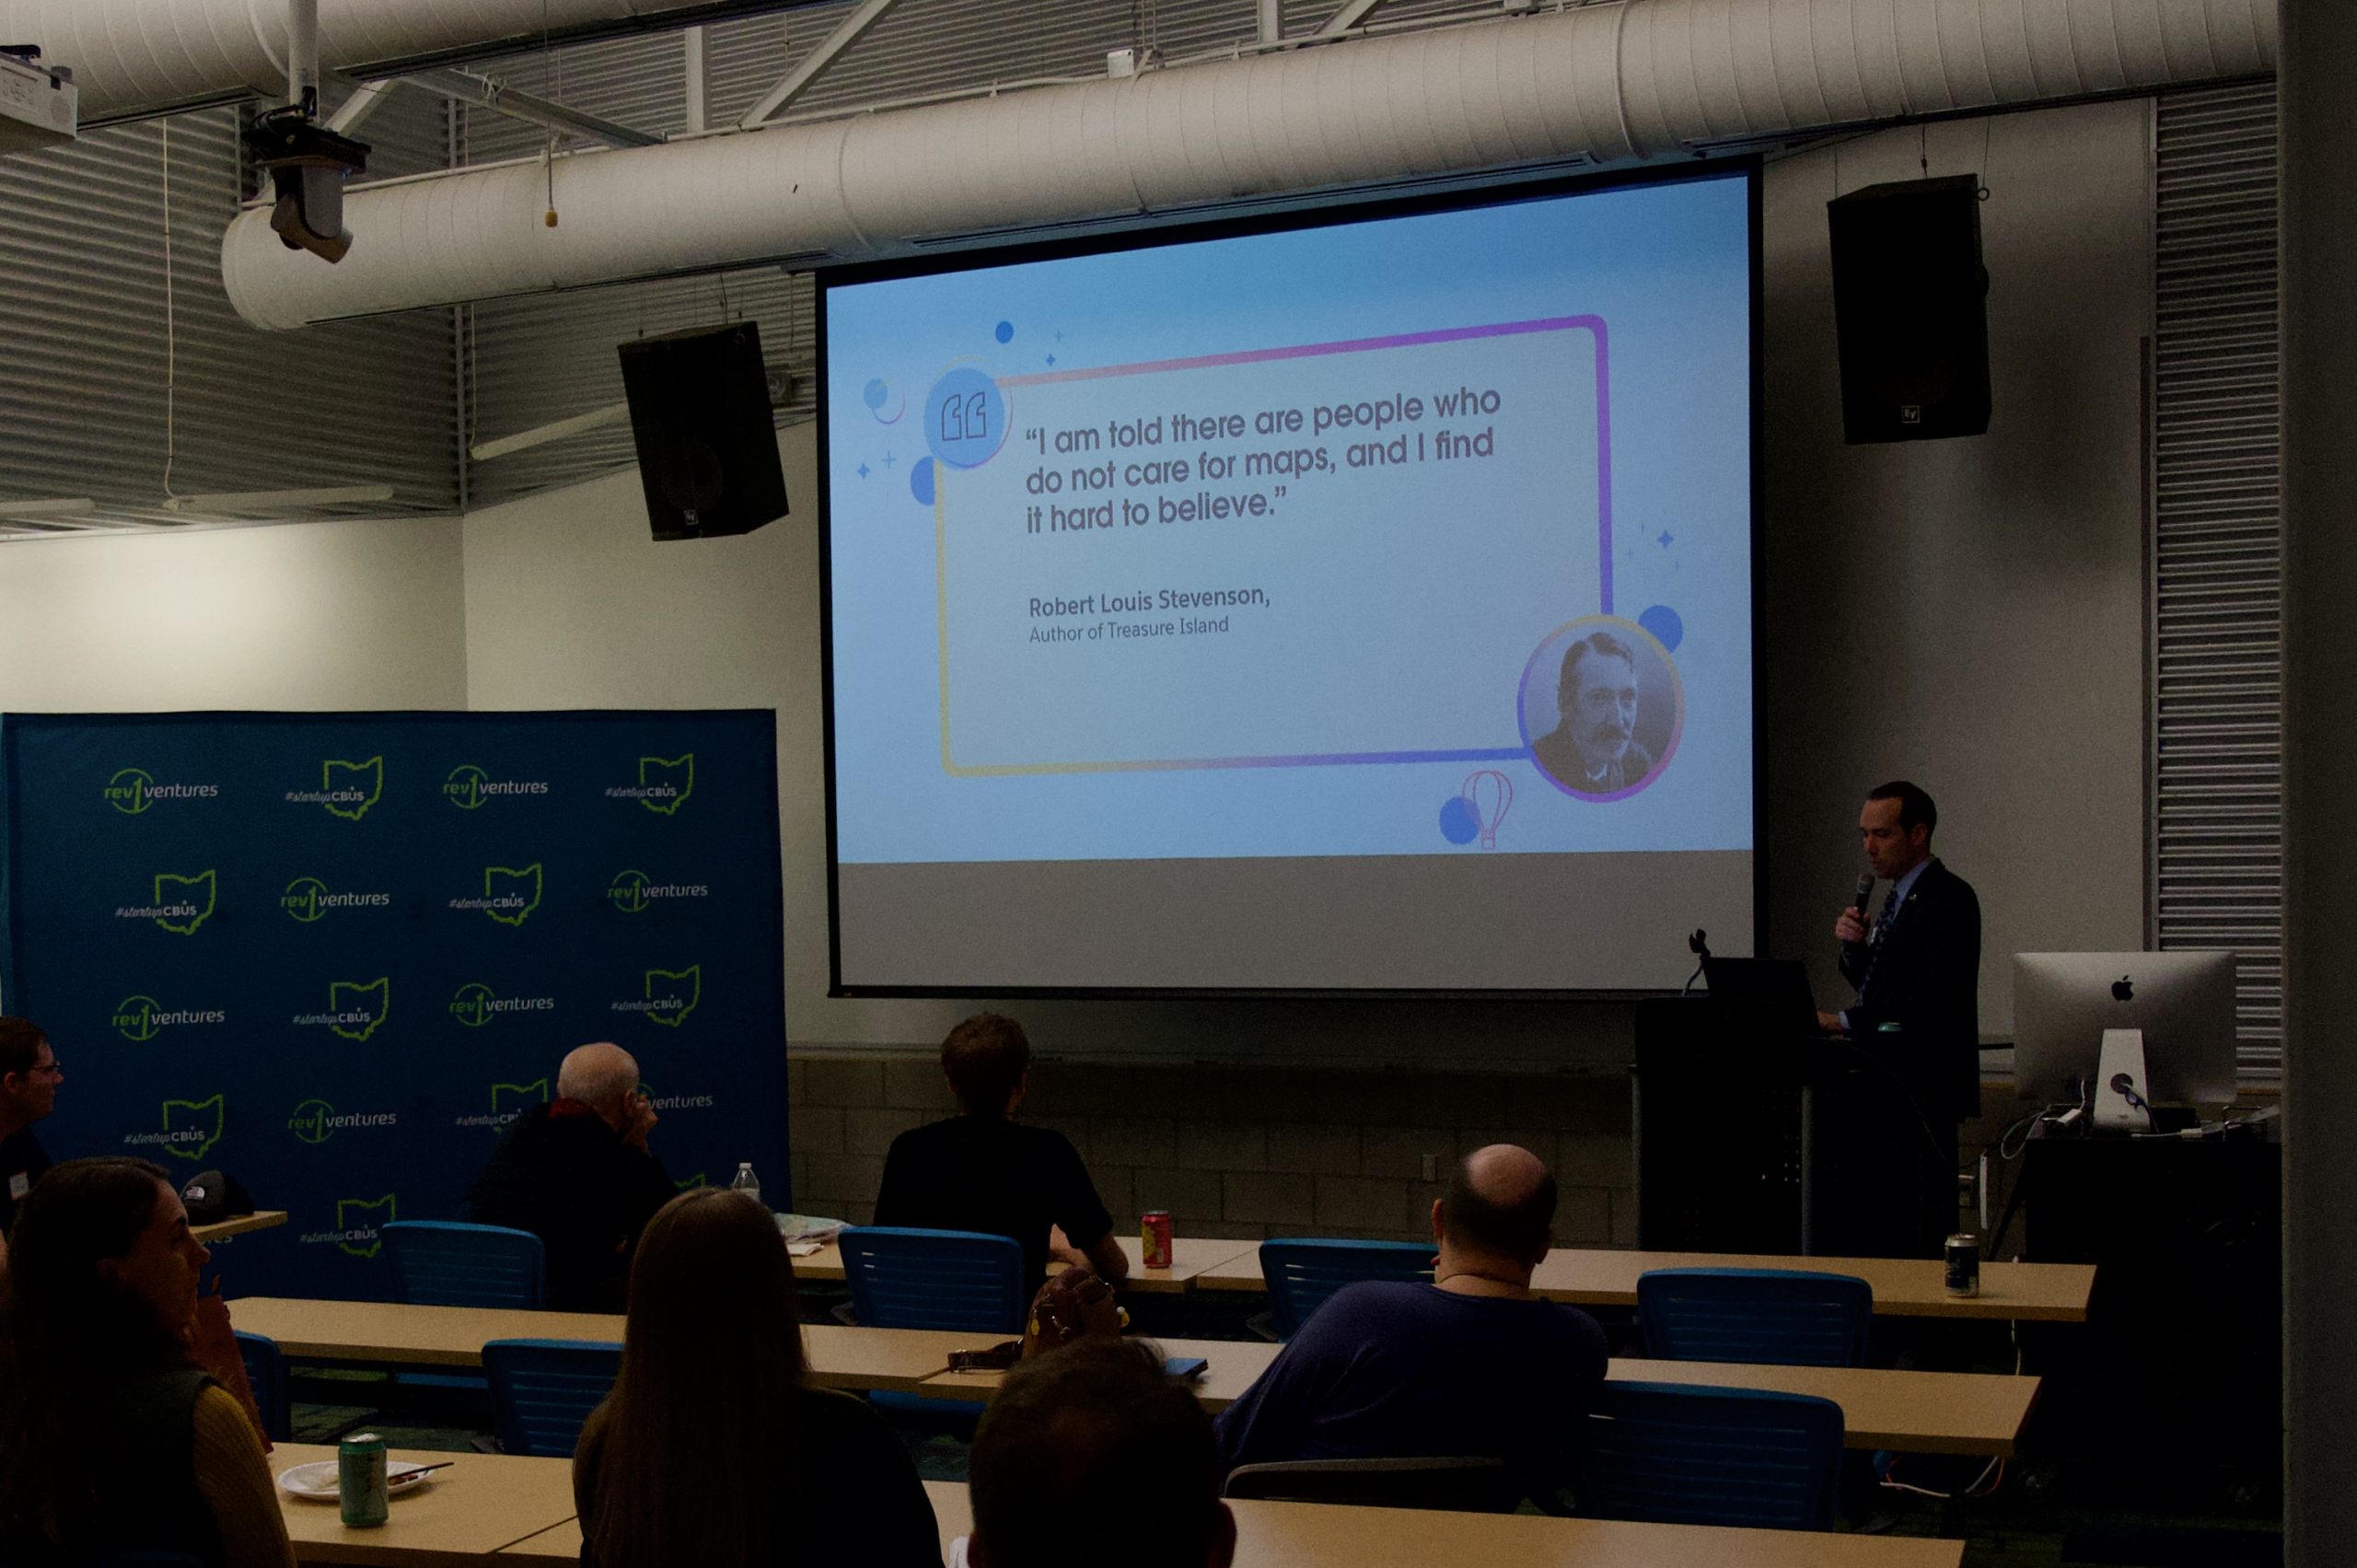
You can check out her 2017 talk on YouTube, but, for her second appearance—the one recapped in this post in 2026—you’ll have to settle for the slides and still photos: